Differentiation – Beyond Bluebirds and Red Birds

Mark Coté, Project Manager, markcote@cpm.org

Whether your course assignments include CC1 or AP Calculus, the reality of teaching is that our students arrive with a diverse set of prior learning experiences and varied instructional needs.  Providing universal access to the curriculum can be a daunting task;  it takes time, effort and ongoing formative assessment to recognize the differences and make instructional adjustments to better meet the needs of individuals.

Can you recall your first experience with differentiation in the classroom?  Mine involved two groups sorted by reading level in the second grade – the bluebirds and the red birds.  Though I cannot recall’t recollect which bird I was, I do remember that each “flock” had different reading materials and remained intact throughout the entire year.  I know that I was always curious about what the other kids were reading.  Due to my visual impairment, I benefited from an additional accommodation; I was provided a set of large-print textbooks which were almost as big as my desktop.  I was fortunate to reside in a progressive school district that recognized the necessity of instructional differentiation and provided a well-funded special education program to implement it.

So how do you differentiate to address issues of equity and access?  Certainly a colorful bird approach in a mathematics classroom would simply exacerbate negative student identities and establish an additional layer of tracking to an educational system that is already fraught with countless structural obstacles.  There must be a happy place between creating 150 individualized worksheets for each day of instruction and a one-size-fits-all curriculum.  Indeed, there is.

The third option is to offer an engaging and enriching problem-solving experience to all students while incorporating intentional, planned differentiation during a given lesson.  Equity does not mean that every student should receive identical instruction; instead, it demands that reasonable and appropriate accommodations be made as needed to promote access and attainment for all students” (NCTM, 2000, p. 12).  Such “reasonable and appropriate accommodations” have been the research interest of Dr. Carol Ann Tomlinson (William Clay Parrish Jr. professor and chair of educational leadership, foundations, and policy at the University of Virginia’s Curry School of Education) for several decades.  Dr. Tomlinson has observed and studied schools in which the entire faculty focused on providing a third condition: differentiation in mixed-ability classrooms where regular planning for a full spectrum of learners—including advanced learners—was a given.  She reports that, “Teachers in those schools typically ‘”taught up,’” planning first for advanced learners, then scaffolding instruction to enable less advanced students to access those rich learning experiences. Further, they extend the initial learning opportunities when they are not sufficiently challenging for highly advanced learners. In those schools, achievement for the full spectrum of learners—including advanced learners—rose markedly when compared to peer schools where this approach was not pervasive.”

This “full spectrum” option has gained traction in many CPM classrooms.  While the number of possible instructional adjustments is infinite, there exists a common pedagogical thread. Productive differentiation begins with the belief that every student can learn the mathematics in the course and that every teacher is capable of improving learning outcomes for their students. Next, culture-building activities help establish an environment of inclusion and encourage students to take personal responsibility for their learning. Teachers model and impart a growth mindset attitude, persistence in the face of adversity, and the value of learning from one’s mistakes. Finally, specific lesson adjustments require anticipation of struggle, data gathering through formative assessment, planning and execution. The following four examples of differentiation address the instructional components of the daily lesson, chapter closure, homework, and assessment.

Further Guidance

Teacher Researcher Angie Kraft, a veteran member of CPM’s Teacher Research Corps (TRC), has spent the past couple of years investigating the process of adjusting course content to increase accessibility.

Our district has spent a lot of time having special education teachers plan with regular education teachers to build scaffolds for one to two core problems for each lesson,” reports Kraft. “These scaffolds are developed carefully to meet specific student needs without a loss of rigor; the goal is to allow every student access to the math regardless of ability level. 

She provided the following Core Connections, Course 1 problem as an example:

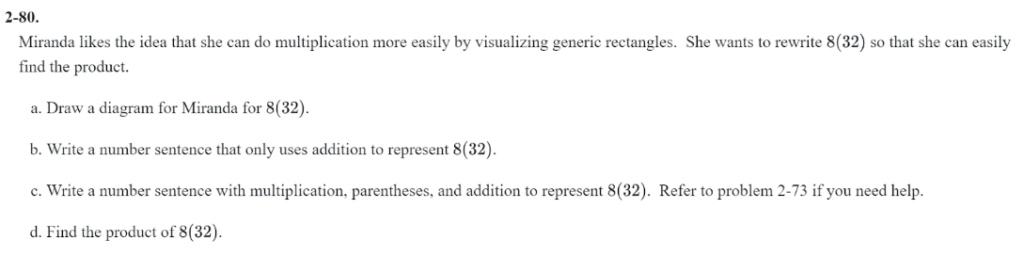
“The teachers collaborated to create a tool to help students visualize the learning target. A generic rectangle was drawn as a graphic organizer so that the students would have an idea about where to put in the values 8, 30, and 2. Then, some used a calculator to find the products inside the rectangle,”  Kraft explained.

“This way, more students were able to access the same material and fully participate with the team. The only drawback was the amount of planning time required as these scaffolds are specific to a given lesson and need. However, the longer we do CPM, the more resources we have developed, stored, and shared among each grade level,” she concluded.

Closure Stations

Teacher Leader and Teacher Researcher Jennifer McCalla has participated in practitioner inquiry with the TRC since 2015. McCalla’s research interests have included student self-assessment and study team improvements. In her TRC white paper entitled Do Your Students Know What They Don’t Know, McCalla explains how she and her team developed learning target trackers and student self-assessment tools to investigate the impact of engaging students in metacognitive behavior. To prepare for a chapter assessment, McCalla created closure stations for each chapter to serve as a self-directed review.  Each table in the classroom focused on a different learning target (typically there were 6 – 7 learning targets for a given test) and had the learning target sign on the table with corresponding practice problems and an answer key for the practice problems (example below).

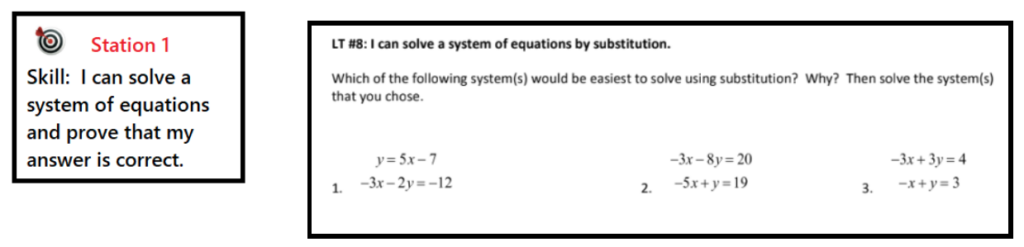
McCalla explained the process. “Before they started the closure stations, students were asked to prioritize the learning targets being tested and number them from weakest to strongest. Then they visited the closure station tables in that order.  This was the first time that the students would not be completing the closure stations with their teams, rather visiting the stations based on their prioritized weaknesses. This was a great way to differentiate their learning and practice based on their past performance. Normally, what I (and many teachers) reviewed in class was at the discretion of the teacher, not the students. This helped the students narrow their focus for studying while reflecting on their strengths and weaknesses. Completing the closure stations allowed all students the opportunity and experience of becoming their own agents for improving their understanding.” An example of a student rating sheet follows.

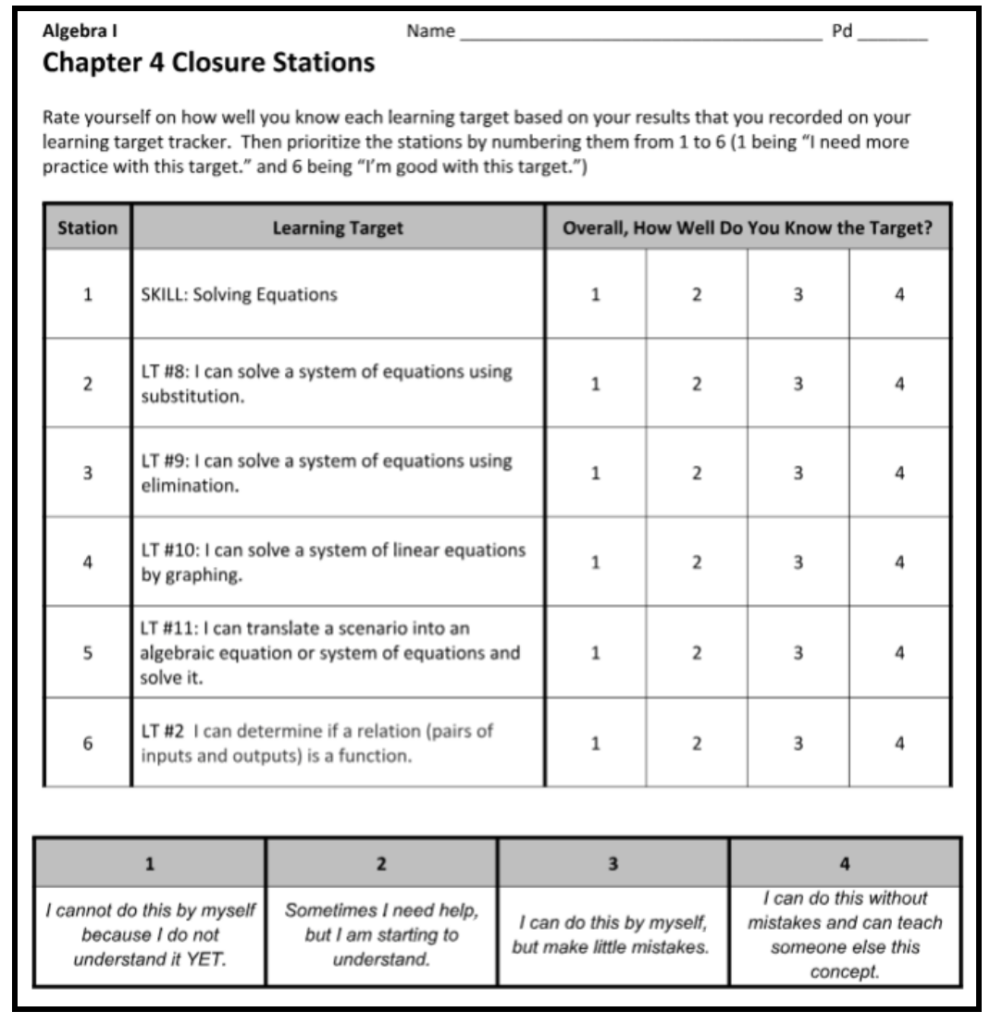
McCalla reported that the students loved the closure stations and, surprisingly, did not follow their friends to the stations, but rather visited in the order in which they rated themselves. They also appreciated knowing which learning targets would be the focus for the upcoming test. Before the next chapter test, the students were begging McCalla to have closure stations and these became a staple in the classroom. An interesting side effect of having the students prioritize their learning targets was that McCalla was physically able to see what learning targets the students needed the most support in when they were asked to go to the station that they set as their first priority.

Traffic Lights

In conjunction with the ongoing formative assessment that occurs during a lesson, many teachers employ opportunities for differentiation using the Review & Preview problems; the emphasis of each set can be adjusted to challenge more advanced learners and to support students who need more work with the fundamental skills and core ideas. CPM Coach and Teacher Leader Tracy Frank learned of a “traffic lights” strategy from several teachers in Wisconsin who were struggling to get their students to try and/or complete any of the assigned problems. Prior to making an assignment, the teachers carefully selected problems from the set that supported the learning intentions, either reinforcing the lesson, reviewing previous material, carrying previously learned concepts into more complex situations or to deeper levels, previewing upcoming material, teaching a simple concept not covered in a lesson, or providing an enrichment opportunity.

Frank explains, “As the assignment was made, selected problems were labeled as either green light, yellow light or red light. Students were taught that the green light problems were mandatory review exercises considered accessible to all students.  Yellow light problems were typically extensions of the day’s lesson or a preview of forthcoming material.” Though recommended, the yellow light problems were optional to all. In some cases, students were given the choice of exchanging the green light problems for the yellow if they felt that they knew the green light material well. Red light problems, typically with an extension or enrichment focus, were also optional.

To date, a number of Teacher Researchers have tried the traffic lights strategy and reported that providing a choice to modify the length of a homework assignment was empowering for the students and resulted in increased engagement in the Review & Preview process.

Test Correction Teams

Teacher Leader and Teacher Researcher Heather Thacket developed a new idea for differentiation when tests were returned to her students.  She found it impossible to meet with every individual student as they corrected their tests – so many questions with so little time! So Thacket created temporary test correction teams based on test results. Each team was comprised of one member who truly struggled, one or two students who did okay, and one member who had demonstrated mastery. All problems were graded using a 4 point rubric and any problem that was scored below a 4 was required to be corrected and submitted for additional credit, so it was a rare occurrence when a particular student had no correcting to do.

Thacket reports, “This works well if you have been using study team teaching strategies all along. The kids are constantly regrouping during the daily lessons, so there is no stigma attached to this particular move following a test. The fact that each team has a leader that can serve as a resource really frees me up to check-in more with each team. I can also get information about common concerns and decide when direct instruction is needed.”

The test correction teams disperse at the end of the period and complete a correction analysis form the following day. Thacket is so happy that she made a change to this part of the assessment process. She states, “Doing this gives them more ownership of their test results and they are more actively engaged in learning from their mistakes. They tell me that they enjoy the opportunity to discuss the work with their peers and fix errors in small groups.”

Differentiation begins with the mindset that the primary objective of mastering essential mathematical knowledge, concepts, and skills remains the same for every student. As we have seen, teachers may use different instructional methods to help students meet those expectations by incorporating further guidance, temporary regrouping and student choice. And no one needs to be a bluebird or a red bird.

Inspiring Connections
Course 1

Prelude

0.1.1 What do they have in common?
0.1.2 How can I effectively communicate with my team?
0.1.3 Is there another perspective?
0.1.4 How can I persevere through struggle?
0.1.5 How can I see this happening?
0.1.6 What patterns can I recognize?
0.1.7 What is the best strategy?
0.1.8 How does respect look?

Chapter 1

1.1 Proportions and Proportional Relationships
1.1.1 How can I determine the length?
1.1.2 How big is a million?
1.1.3 How can I predict the outcome?
1.1.4 What is your fair share?
1.1.5 How can I prove two ratios form a proportion?
1.1.6 What is the relationship between the numbers?
1.2 Integer Operations
1.2.1 How can I change temperatures?
1.2.2 How can I show my thinking?
1.2.3 How can adding zero help?
1.2.4 How can I multiply integers?
1.2.5 How can I divide integers?
1.2.6 How can I compose numbers?
1.2.7 What is My Number?
1.3 Proportions and Graphs
1.3.1 How can a graph tell a story?
1.3.2 How do graphs, scale, and proportions connect?

Chapter 2

2.1 Fraction and Decimal Conversions
2.1.1 How can I rewrite it?
2.1.2 How do I write it?
2.1.3 Which representations are equivalent?
2.2 Probability
2.2.1 Is it likely or unlikely?
2.2.2 How can I represent probability as a fraction, decimal, and percent?
2.2.3 How does probability work in real-world situations?
2.2.4 How can I predict the theoretical probability using experimental data?
2.3 Scale Drawings
2.3.1 How can I determine the distance?
2.3.2 How can I enlarge a shape?
2.3.3 Does that look right?
2.3.4 Is it a scaled copy?
2.3.5 What is the best scale?
2.4 Cross Sections
2.4.1 What do I see when I slice a three-dimensional object?
2.4.2 How are cross sections and volume related?

Chapter 3

3.1 Proportional Relationships
3.1.1 How does it grow?
3.1.2 How does the money grow?
3.1.3 Is this a proportional relationship?
3.1.4 How can I create a graph?
3.1.5 What do the points mean?
3.1.6 What connections can I make?
3.2 Data and Statistics: Using Samples to Make Predictions
3.2.1 What connections can I make?
3.2.2 Which sample is more accurate?
3.2.3 Does the sample represent the population?
3.2.4 How close is my sample?
3.2.5 How are the problems related?

Chapter 4

4.1 Multiple Representations of Proportional Relationships
4.1.1 How fast can I click?
4.1.2 How can I determine which grows faster?
4.1.3 How do I see the unit rate?
4.1.4 How can I write an equation?
4.1.5 What is the better deal?
4.1.6 What impact do I have?
4.1.7 How can I calculate values more efficiently?
4.1.8 How can I convert between different units of measurement?
4.1.9 How can I make the connections?
4.2 Circumference and Area of a Circle
4.2.1 How are they proportional?
4.2.2 How much space is inside?
4.2.3 What is the formula for the area of a circle?
4.2.4 How can the formula for the area of a circle help me?

Chapter 5

5.1 Probability
5.1.1 What are the chances?
5.1.2 How can I calculate the probability of more than one event?
5.1.3 What if there is more than one event?
5.1.4 What if there are more than two events?
5.1.5 How can I determine all of the outcomes?
5.1.6 What if it is more complicated?
5.2 Integer Operations Continued
5.2.1 How does each operation move points on a number line?
5.2.2 How can I show division?
5.2.3 How can I calculate it?
5.2.4 How can I check my guess?

Chapter 6

6.1 Data Distributions
6.1.1 Who is steadier?
6.1.2 How different are they?
6.1.3 How do they compare?
6.1.4 Who is more efficient?
6.1.5 How can I simulate a sample?
6.2 Numerical and Algebraic Expressions
6.2.1 How can I combine them?
6.2.2 How can I rewrite an expression?
6.2.3 How can I write an expression with negatives?
6.2.4 What does zero look like?
6.2.5 How does it move?
6.3 Equivalent Expressions
6.3.1 How can I group them?
6.3.2 Are they equivalent?
6.3.3 What are the connections?

Chapter 7

7.1 Operations With Rational Numbers
7.1.1 Will the amount increase or decrease?
7.1.2 Are differences and distance the same?
7.1.3 Can I add these?
7.2 Percent Change
7.2.1 Does this represent an increase or a decrease?
7.2.2 How does this change the total?
7.2.3 How is the money split?
7.2.4 Do I pay more?
7.3 Percents in the Real World
7.3.1 Is this good for business?
7.3.2 How much did it change?
7.3.3 Is this acceptable?
7.3.4 How are percents represented in expressions?
7.3.5 Which is easier, calculating with fractions or decimals?

Chapter 8

8.1 Multiplication and Division of Rational Numbers
8.1.1 Is the product positive or negative?
8.1.2 How are multiplication and division connected?
8.1.3 What is the relationship?
8.1.4 How can I divide?
8.1.5 How do I solve it?
8.2 Working With Expressions
8.2.1 Which is greater?
8.2.2 How can I record my work?
8.2.3 What happens when the comparison depends on x?

Chapter 9

9.1 Angle Relationships
9.1.1 How can I draw an angle?
9.1.2 How can I combine angles?
9.1.3 How can I calculate the measure of a missing angle?
9.2 Triangle Creation
9.2.1 How can I put angles and lengths together?
9.2.2 Will these lengths make a triangle?
9.2.3 How many triangles? 9.2.4 Can I construct it?
9.3 Volume and Surface Area
9.3.1 How much material do I need?
9.3.2 How do I calculate the surface area and volume?
9.3.3 How much will it hold?
9.3.4 What am I measuring?

Chapter 10

10.1: Explorations and Investigations
10.1.1 How can I make 0?
10.1.2 What number properties pair well?
10.1.3 How can you place algebraic expressions on the number line?
10.1.4 How can I solve it?
10.1.5 What can you say about the sums of consecutive numbers?
10.2: Restaurant Math
10.2.1 How can you draw it to scale?
10.2.2 How can you calculate the cost?
10.2.3 What do portions have to do with proportions?
10.2.4 What markdown undoes a markup?

Inspiring Connections
Course 2

Prelude

0.1.1

Who are my classmates?

0.1.2

How do I work collaboratively?

0.1.3

What questions can I ask?

0.1.4

How can I categorize my words?

0.1.5

How can I communicate my ideas?

0.1.6

How can the team build this together?

0.1.7

What do we need to work togethe


Chapter 1

1.1 Numbers and Data

1.1.1 How should data be placed on this line?

1.1.2 Where do these numbers belong on this line?

1.1.3 How can I use two lines to solve problems?

1.1.4 How can data be used to answer a question?

1.1.5 How are histograms helpful?

1.1.6 How else can data be displayed?

1.2 Shapes and Area,

1.2.1 How can I write equivalent expressions in area and perimeter?

1.2.2 What shapes make up the polygon?

1.2.3 How can I make it a rectangle?

1.3 Expressions

1.3.1 How can I describe it using symbols?

1.3.2 What are the parts of an expression?

1.3.3 How do I work with decimals?

1.3.4 How do I multiply multi-digit decimals?

1.3.5 How can I represent the arrangement?

Chapter 2

2.1 Ratio Language

2.1.1 How can I compare two quantities? 

2.1.2 How can I write ratios?

2.1.3 How can I see ratios in data representations?

2.2 Equivalent Ratios

2.2.1 How can I visualize ratios?

2.2.2 How can I see equivalent ratios in a table?

2.2.3 How can I see equivalent ratios in a double number line?

2.2.4 How can I see equivalent ratios in tape diagrams?

2.2.5  How can I use equivalent ratios?

2.2.6 What do these represent?

2.3 Measurement

2.3.1 What are the measurements?

2.3.2 What are the units?

2.3.3 How can I convert units

Chapter 3

3.1 Measures of Center 

3.1.1 How can I measure the center?

3.1.2 How else can I measure the center?

3.1.3 Which is the better measure of center?

3.1.4 What happens when I change the data?

3.2 Integers

3.2.1 What numbers do I see?

3.2.2 What number is this?

3.2.3 What does a number line say about a number?

3.2.4 How do I compare different types of numbers?

3.3 Absolute Value

3.3.1 How do I describe the location?

3.3.2 How far do I walk?

3.3.3 Which one is greater?

3.3.4 How do I communicate mathematically?


3.4 Coordinate Plane

3.4.1 How can you precisely indicate a location?

3.4.2 What is the correct order?

3.4.3bWhat symbol represents me?

Chapter 4

4.1 Fractions, Decimals, and Percents
4.1.1 How can I tell if the ratios are equal?
4.1.2 What does “percent” mean?
4.1.3 How can I convert a fraction?
4.1.4 How can I convert a percent?
4.1.5 How can I convert a decimal?

4.2 Percents 4.2.1 How can I show it?
4.2.2 What can I learn from the label?
4.2.3 Are the percents fair?
4.3 Unit Rates in Tables and Graphs 4.3.1 How can I compare rates?
4.3.2 Which rate is better?
4.3.3 Which deal is best?
4.3.4 What is the unit rate?
4.3.5 How can I use different data representations?

Chapter 5

5.1 Variation in Data
5.1.1 How do I ask a statistical question?
5.1.2 What does each representation say about the data?
5.1.3 What does the box in a box plot represent?
5.1.4 How else can I describe data?

5.2 Area
5.2.1 What is the height?
5.2.2 Can I reconfigure a parallelogram into a rectangle?
5.2.3 How do I calculate the area?
5.2.4 How many triangles do I need?
5.2.5 What is my perspective?
5.2.6 Is it fair to play by the rules?
5.2.7 What shapes do I see?

5.3 Fractions
5.3.1 How can I represent fraction multiplication?
5.3.2 How can I multiply fractions?
5.3.3 How can I multiply mixed numbers?

Chapter 6

6.1 Rules of Operations
6.1.1 What does it mean?
6.1.2 What do mathematicians call this?
6.1.3 How much should I ask for?
6.1.4 How can I write mathematical expressions?
6.1.5 How do mathematicians abbreviate?
6.1.6 In what order should I evaluate?

6.2 Multiples and Factors
6.2.1 When will they be the same?
6.2.2 What are multiples?
6.2.3 What do they have in common?
6.2.4 Who is your secret valentine?
6.2.5 How can I understand products?
6.2.6 How can I rewrite expressions?
6.2.7 Which method do I use?

Chapter 7

7.1 Whole Number and Decimal Division
7.1.1 How can I share equally?
7.1.2 Which strategy is the most efficient?
7.1.3 How can I write the number sentence?
7.1.4 How can I divide decimals?
7.1.5 How should the problem be arranged?

7.2 Fraction Division
7.2.1 What if the divisor is a fraction?
7.2.2 How many fit?
7.2.3 How can I visualize this?
7.2.4 What is common about this?
7.2.5 How can I use a Giant One?
7.2.6 Which method is most efficient?

Chapter 8

8.1. Algebra Tiles
8.1.1 What do these shapes represent?
8.1.2 What does a group of tiles represent?
8.1.3 What is an equivalent expression?
8.1.4 Which terms can be combined?
8.1.5 What do the numbers mean?
8.1.6 What can a variable represent?

8.2 Expressions
8.2.1 How can I count it?
8.2.2 What if the size of the pool is unknown?
8.2.3 How can I use an algebraic expression?

8.3 Equations and Inequalities
8.3.1 Which values make the equation true?
8.3.2 How can patterns be represented?
8.3.3 What is the equation?
8.3.4 How many could there be?

Chapter 9

9.1 Equations and Inequalities Continued
9.1.1 When is the statement true?
9.1.2 How do I undo that?
9.1.3 How can I visualize an equation?
9.1.4 How can I solve an equation?
9.1.5 How can I make the unknown known?
9.1.6 How can I include all the solutions?
9.1.7 Which method should I use?
9.2 Rate Problems
9.2.1 How much does rice cost?
9.2.2 How long will it take?
9.2.3 How can I compare them?
9.2.4 How long will the race take?
9.2.5 How can I represent the rate?

Chapter 10

10.1: Explorations and Investigations
10.1.1 How can I make 0?
10.1.2 What number properties pair well?
10.1.3 How can you place algebraic expressions on the number line?
10.1.4 How can I solve it?
10.1.5 What can you say about the sums of consecutive numbers?
10.2: Restaurant Math
10.2.1 How can you draw it to scale?
10.2.2 How can you calculate the cost?
10.2.3 What do portions have to do with proportions?
10.2.4 What markdown undoes a markup?

Chapter 11

11.1: Ratios and Proportions
11.1.1 How much food is there?
11.1.2 How much do we need?
11.1.3 How much is that?
11.1.4 How can I redesign the classroom?
11.2: The Number System
11.2.1 Can I determine all the right measurements?
11.2.2 How can I show my understanding?

Inspiring Connections
Course 3

Prelude

0.1.1 What can I learn from my classmates?
0.1.2 How can shapes move?
0.1.3 What does respect mean to me?
0.1.4 What story might this represent?
0.1.5 Do all cities value parks the same?
0.1.6 How can I contribute to my team?

Chapter 1

1.1 Data and Graphs
1.1.1 How can I represent data?
1.1.2 How can I use data to solve a problem?
1.1.3 Is the roller coaster safe?
1.1.4 Is there a relationship?
1.1.5 What is the relationship?

1.2 Introduction to Transformations
1.2.1 How can I move a figure on the coordinate plane?
1.2.2 How can I describe the steps precisely?
1.2.3 Is there another way?
1.3 Linear Relationships
1.3.1 How can I graph a proportional relationship?
1.3.2 How do they compare?
1.3.3 Can I graph myself?
1.3.4 How can I represent this with a graph?
1.3.5 How can I graph a linear relationship?

Chapter 2

2.1 Rigid Transformations
2.1.1 How can I describe it?
2.1.2 How does reflection affect coordinates?
2.1.3 What can I create?
2.2 Similarity
2.2.1 What if I multiply?
2.2.2 How do shapes change?
2.2.3 What can I say about dilated shapes?
2.2.4 Are they similar?
2.2.5 How can I move a shape on a coordinate plane?
2.3 Graphing Systems of Equations
2.3.1 Where do the lines cross?
2.3.2 Will different tile patterns ever have the same number of tiles?

Chapter 3

3.1 Trend Lines
3.1.1 Are these variables related?
3.1.2 Which line fits the data well?
3.1.3 How can this association be explained?
3.2 Solving Equations with Algebra Tiles
3.2.1 How can I represent an expression?
3.2.2 How can I rewrite an expression?
3.2.3 How can I compare two expressions?
3.2.4 How can I solve the equation?
3.3 Graphing Linear Equations
3.3.1 What is the rule?
3.3.2 How can I make a prediction?
3.3.3 What is a graph and how is it useful?
3.3.4 How should I graph?
3.3.5 What observations can I make about a graph?

Chapter 4

4.1 Exponents, Part 1
4.1.1 What is exponential growth?
4.1.2 How can you (re)write it?
4.1.3 How can notation help you make sense of exponential expressions?
4.1.4 Are there other exponent properties?
4.1.5 How can I prevent common exponential expression errors?
4.2 Solving Equations
4.2.1 How can I check my answer?
4.2.2 Is there always a solution?
4.2.3 How many solutions are there?
4.2.4 How can I solve complicated equations?
4.2.5 How can I write an equation to meet the criteria?
4.3 Exponents, Part 2
4.3.1 What if the exponent is not positive?
4.3.2 How do you know which exponent properties to use?

Chapter 5

5.1 Representations of a Line
5.1.1 What is the connection?
5.1.2 How can you show it?
5.1.3 How does it grow?
5.1.4 How is the growth represented?
5.1.5 How can I write the rule?
5.1.6 How can you make connections?
5.1.7 How can you use growth?
5.1.8 What are the connections?
5.2 Graphs & Equations of Systems
5.2.1 How can I change it to y = mx + b form?
5.2.2 How can I eliminate fractions and decimals in equations?
5.2.3 How do I change the line?
5.2.4 Is the intersection significant?
5.2.5 What is the equation?

Chapter 6

6.1 Solving Systems Algebraically
6.1.1 Where do the lines intersect?
6.1.2 When are they the same?
6.1.3 What if the equations are not in y = mx + b form?
6.1.4 How many solutions are there?
6.2 Slope & Rate of Change
6.2.1 What is the equation of the line?
6.2.2 How does y change with respect to x?
6.2.3 When is it the same?
6.2.4 What’s the point?
6.2.5 Can I connect rates to slopes?
6.3 Associations
6.3.1 What is the equation for a trend line?
6.3.2 How can I use an equation?
6.3.3 What if the data is not numerical?
6.3.4 Is there an association?

Chapter 7

7.1 Angles
7.1.1 How are the angles related?
7.1.2 Are there other congruent angles?
7.1.3 What about the angles in a triangle?
7.1.4 What if the angle is on the outside?
7.1.5 Can angles show similarity?
7.2 Right Triangle Theorem
7.2.1 Can I make a right triangle?
7.2.2 What is special about a right triangle?
7.2.3 How can I calculate the side length?
7.2.4 What kind of number is it?
7.2.5 How can I use the Right Triangle Theorem to Solve Problems?
7.2.6 How can I determine lengths in three dimensions?
7.2.7 How can I prove it?

Chapter 8

8.1Introduction to Functions


8.1.1

How can you (de)code the message?


8.1.2

How can a graph tell a story?


8.1.3

What can you predict?


8.1.4

Which prediction is best?


8.1.5

How does the output change based on the input?


8.1.6

How do you see the relationship?

8.2

 Characteristics of Functions


8.2.1

What is a function?


8.2.2

How can you describe the relationship?


8.2.3

How do I sketch it?


8.2.4

How many relationships are there?

8.3

Linear and Nonlinear Functions


8.3.1

Is it linear or nonlinear?


8.3.2

What clues do ordered pairs reveal about a relationship?


8.3.3

What other functions might you encounter?

Chapter 9

9.1Volume


9.1.1

Given the volume of a cube, how long is the side?


9.1.2

What if the base is not a polygon?


9.1.3

What if the layers are not the same?


9.1.4

What if it is oblique?


9.1.5

What if it is a three-dimensional circle?

9.2

Scientific Notation


9.2.1

How can I write very large or very small numbers?


9.2.2

How do I compare very large numbers?


9.2.3

How do I multiply and divide numbers written in scientific notation?


9.2.4

How do I add and subtract numbers written in scientific notation?


9.2.5

How do I compute it?

9.3

Applications of Volume


9.3.1

What does a volume function look like?


9.3.2

What is the biggest cone?


9.3.3

How do all the items fit together?

Chapter 10

10.1Explorations and Investigations


10.1.1

How close can I get?


10.1.2

Can you make them all?


10.1.3

How many triangles will there be?


10.1.4

What’s my angle?


10.1.5

Function-function, what’s your function?


10.1.6

Is it always true?


10.1.7

What’s right?


10.1.8

What’s your story?

You are now leaving cpmstg.wpengine.com.

Did you want to leave cpmstg.wpengine.com?

I want to leave cpmstg.wpengine.com.

No, I want to stay on cpmstg.wpengine.com

Algebra Tiles Blue Icon

Algebra Tiles Session

  • Used throughout CPM middle and high school courses
  • Concrete, geometric representation of algebraic concepts.
  • Two-hour virtual session,
  •  Learn how students build their conceptual understanding of simplifying algebraic expressions
  • Solving equations using these tools.  
  • Determining perimeter,
  • Combining like terms,
  • Comparing expressions,
  • Solving equations
  • Use an area model to multiply polynomials,
  • Factor quadratics and other polynomials, and
  • Complete the square.
  • Support the transition from a concrete (manipulative) representation to an abstract model of mathematics..

Foundations for Implementation

This professional learning is designed for teachers as they begin their implementation of CPM. This series contains multiple components and is grounded in multiple active experiences delivered over the first year. This learning experience will encourage teachers to adjust their instructional practices, expand their content knowledge, and challenge their beliefs about teaching and learning. Teachers and leaders will gain first-hand experience with CPM with emphasis on what they will be teaching. Throughout this series educators will experience the mathematics, consider instructional practices, and learn about the classroom environment necessary for a successful implementation of CPM curriculum resources.

Page 2 of the Professional Learning Progression (PDF) describes all of the components of this learning event and the additional support available. Teachers new to a course, but have previously attended Foundations for Implementation, can choose to engage in the course Content Modules in the Professional Learning Portal rather than attending the entire series of learning events again.

Edit Content

Building on Instructional Practice Series

The Building on Instructional Practice Series consists of three different events – Building on Discourse, Building on Assessment, Building on Equity – that are designed for teachers with a minimum of one year of experience teaching with CPM instructional materials and who have completed the Foundations for Implementation Series.

Building on Equity

In Building on Equity, participants will learn how to include equitable practices in their classroom and support traditionally underserved students in becoming leaders of their own learning. Essential questions include: How do I shift dependent learners into independent learners? How does my own math identity and cultural background impact my classroom? The focus of day one is equitable classroom culture. Participants will reflect on how their math identity and mindsets impact student learning. They will begin working on a plan for Chapter 1 that creates an equitable classroom culture. The focus of day two and three is implementing equitable tasks. Participants will develop their use of the 5 Practices for Orchestrating Meaningful Mathematical Discussions and curate strategies for supporting all students in becoming leaders of their own learning. Participants will use an equity lens to reflect on and revise their Chapter 1 lesson plans.

Building on Assessment

In Building on Assessment, participants will apply assessment research and develop methods to provide feedback to students and inform equitable assessment decisions. On day one, participants will align assessment practices with learning progressions and the principle of mastery over time as well as write assessment items. During day two, participants will develop rubrics, explore alternate types of assessment, and plan for implementation that supports student ownership. On the third day, participants will develop strategies to monitor progress and provide evidence of proficiency with identified mathematics content and practices. Participants will develop assessment action plans that will encourage continued collaboration within their learning community.

Building on Discourse

In Building on Discourse, participants will improve their ability to facilitate meaningful mathematical discourse. This learning experience will encourage participants to adjust their instructional practices in the areas of sharing math authority, developing independent learners, and the creation of equitable classroom environments. Participants will plan for student learning by using teaching practices such as posing purposeful questioning, supporting productive struggle, and facilitating meaningful mathematical discourse. In doing so, participants learn to support students collaboratively engaged with rich tasks with all elements of the Effective Mathematics Teaching Practices incorporated through intentional and reflective planning.