Choose CPM
CPM Educational Program provides both:
CPM’s Foundation
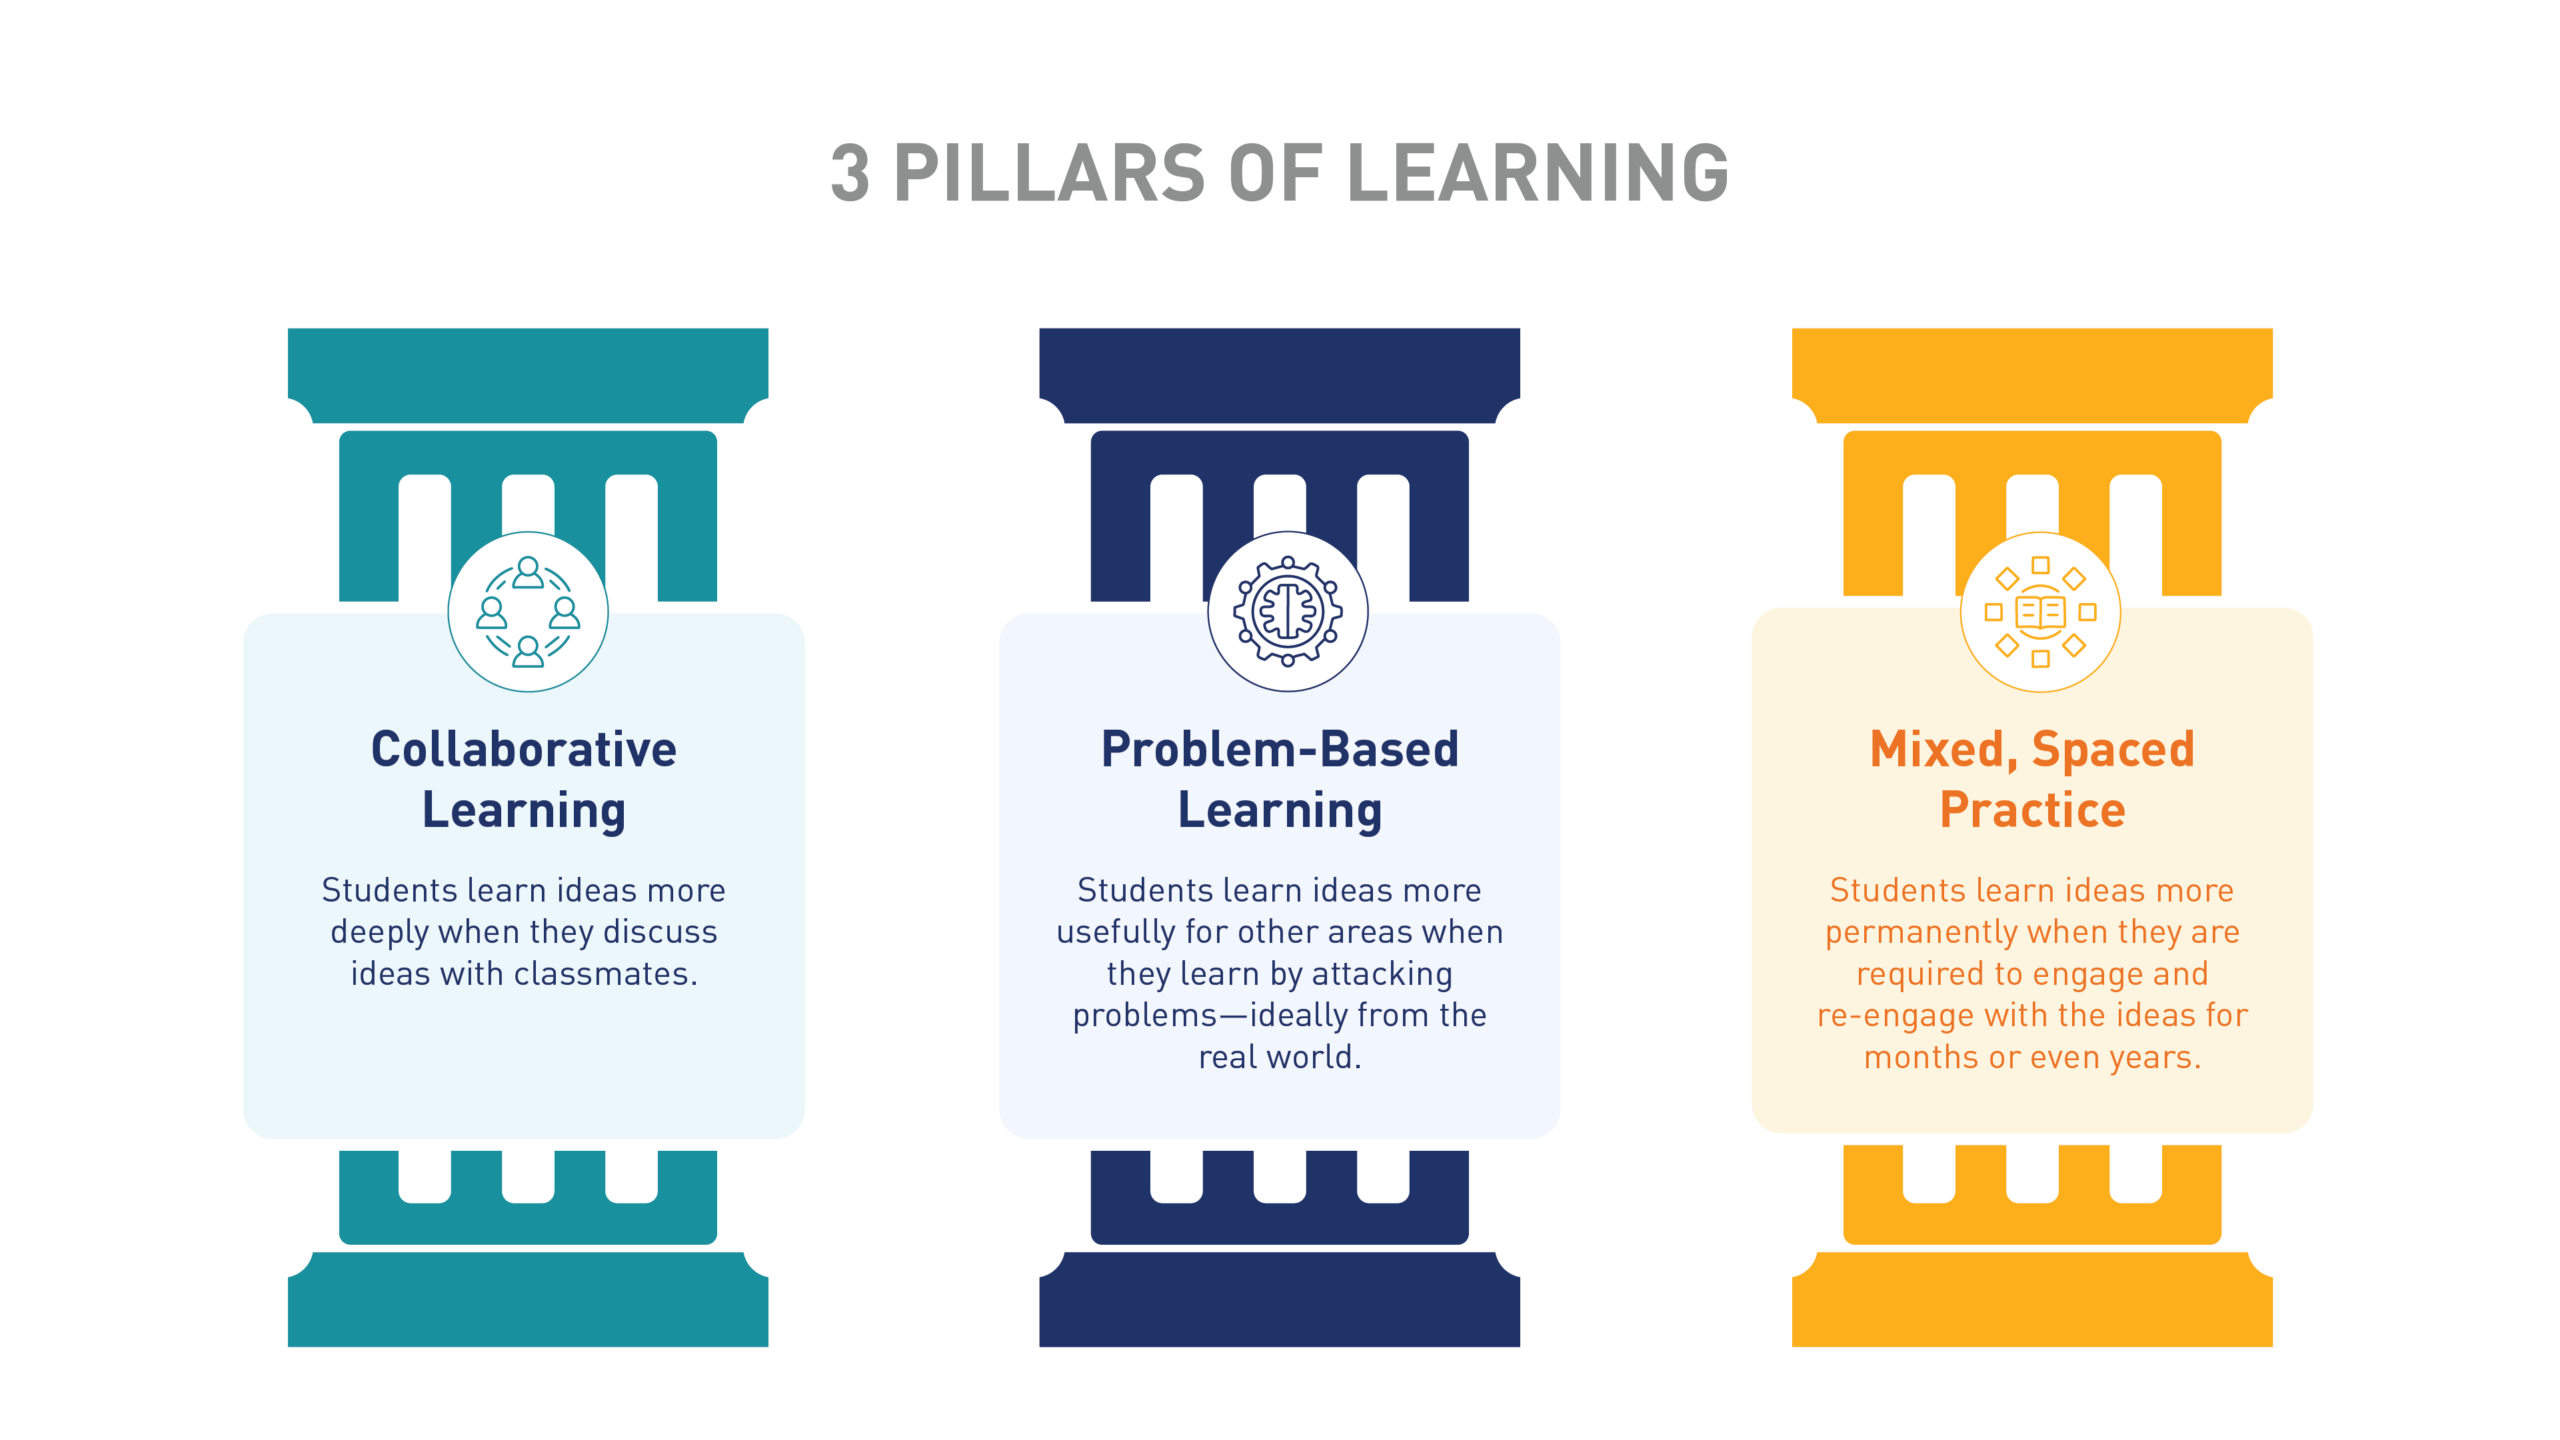
Synthesized from NCTM standards and decades of research, CPM’s Three Pillars are reflected in current mathematics education scholarship, and their benefits only deepen over time.
Pillar 01
Collaborative Learning
Students learn ideas more deeply when they discuss ideas with classmates. Initial learning is best supported by discussions within cooperative learning groups, guided by a knowledgeable teacher.
Pillar 02
Problem-Based Learning
Students learn ideas more usefully for other areas when they learn by attacking problems, ideally from the real world. Integration of knowledge is best supported by engagement with a wide array of problems.
Pillar 03
Mixed Spaced Practice
Students learn ideas more permanently when they are required to engage and re-engage with ideas for weeks or even months. Long-term retention is best supported by spaced practice and spiraling.
These pillars are reflected in current NCTM standards and research in mathematics education, what we know about their benefits for mathematics learning continues to deepen and expand but not shift.

CPM's Approach
CPM Educational Program, a California nonprofit, has provided problem-based instructional materials and professional development for teachers since 1989. The research-informed principles that guide every CPM course are:
Evidence & Resources
EdReports.org provides independent, in-depth reviews of instructional materials. CPM's curricula have been reviewed across middle school and high school series.

Positioning Statements