Graffiti It! A Team Building Activity

Penny Smits, De Pere, WI, pennysmits@cpm.org

Study teams are at the heart of the CPM curriculum. Truly, this is the place where mathematics comes alive for students, through discourse and discovery within their teams. When a study team is working like a well-oiled machine, it is beautiful to observe. Every student has a voice and is bringing his/her strengths to the team environment. However, when a team is not working well, the mathematical experience is not the same for all members. Can we help create an environment within study teams on a daily basis so that the learning is being maximized within the classroom? How can we as teachers make students more cognizant of the impact they have on how other students feel about themselves?

In an attempt to create a more equitable math experience in the study team environment, the Graffiti It activity was conceived. After students finished the first chapter test, I had them create their own graffiti sheet, following simple instructions. Using cardstock, students were to craft their name somewhere on the page; the only parameter I placed on this was that it could not take up the entire page. They were allowed to add a design or use color if they wanted to. I made no mention of what the page was going to be used for. I was pleasantly surprised on how much detail and pride many of the students took in creating their own graffiti page. As I was walked around, I kept dreaming of all the possibilities of how this graffiti page could bring a more open and rich mathematical experience to all of my students.

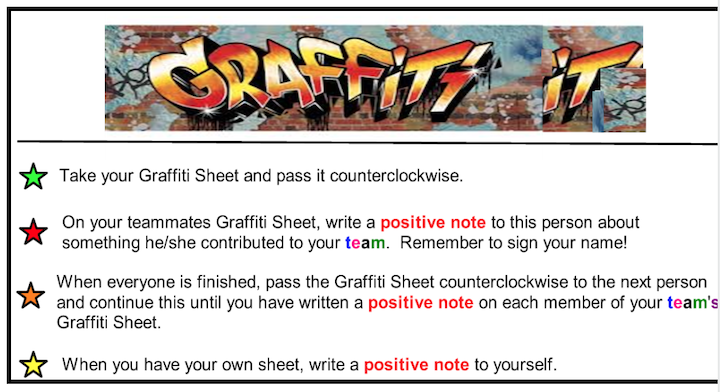
Now that the groundwork for the graffiti sheets was set, students were ready for the next step. Before switching teams, I had all teams complete the Graffiti It activity. Students were to follow the directions in the box at right. The entire activity took about seven minutes to complete. I tried to restrain myself on giving students examples of what to write because I really wanted to see what they could come up with on their own. Surprisingly, students really did not ask too many questions about the activity and got down to writing positive notes to their classmates. When the activity was done, I had students thank their team members before switching to new teams.

It should be noted that students did not know that they were going to be doing this activity and as a result, they crafted positive contributions of their teammates on the spot. This is reflected in some of the earlier comments on the graffiti sheets. To help remedy this, I informed the students that they would be adding to their graffiti sheets every chapter. My thought was that it would get the students thinking more about what they personally were contributing to the team as well as what their teammates were contributing to make the learning successful for everyone.

Students have now successfully completed graffiti sheets for three chapters. As I read through the first round of graffitti sheets, I was pleasantly surprised by what students wrote. Some of them really delved into the positive contributions that their team members made to the team while others talked more about a person’s traits such as “you are nice.” I was expecting some of these types of comments since the activity was new to the students, and I had given them no warning as to what was coming. This gave me a point to discuss with my students to help them separate personality traits from those qualities that allow everyone to contribute to the study team environment in a way that was productive to all members. I wanted them to see that not a single one of us, individually, has all the abilities to solve every math problem, but that each one of us has some of the abilities that will move us closer to finding a solution.

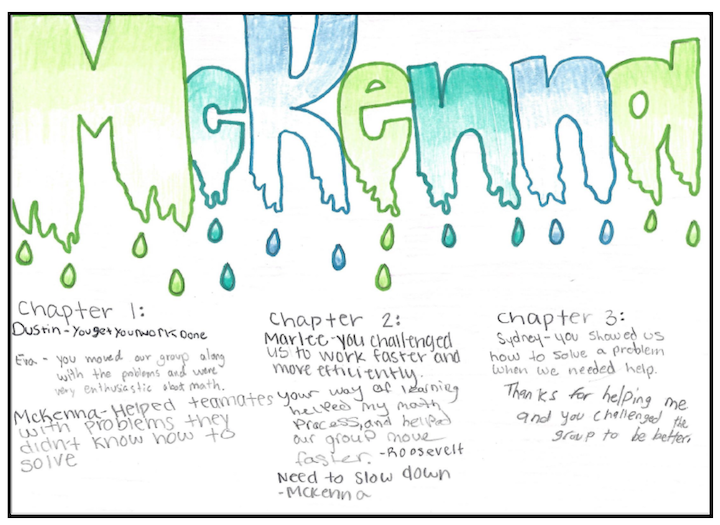
At right is a student’s graffiti sheet. Note the positive contributions that her classmates thought that McKenna brought  to the team. They were very similar to those that I noted about McKenna throughout the chapter. Another valuable insight this student learned while working with others is that she needs to slow down to allow others time to think.

Below are some other common comments that have appeared on the graffiti sheets over the past three chapters.

  • “You helped me with my math when I had no clue what I was doing.”
  • “You helped the team when we were confused.”
  • “You challenged me to rethink the problem.”
  • “You were open to different perspectives of a problem.”
  • “You helped when small mistakes were made.”
  • “Came to class with a positive attitude.”
  • “You helped me look at the math problem differently.”
  • “You made everyone think twice.”
  • “Thanks for helping me with the math.”
  • “I think I did good in my team because if all of us were struggling, I would still share ideas.”
  • “I challenged myself.”

One of the recurring comments that continues to strike me is, “You helped me work out the answers if I didn’t know them.” Is this a key to having successful teams? The ability to show empathy for a teammate seems to be a powerful connection that many students made to their classmates. Does this help level the playing field and open the mathematics door for those who might struggle with a concept? Does this help all team members to see that it is okay to not know something or to make a mistake and be free from judgement of others? How can we foster this more?

Another powerful comment from a graffiti sheet was for a student who showed a lot of compassion for another student who was struggling. The student who struggled commented, “You were good at asking if anyone needed help.” Could simply asking a teammate if he/she needs help support the students that sometimes struggle? Does this demonstrate to others that it is okay to struggle and that they are all in this together? Was this student the voice for a teammate who was not quite ready to bring her voice to the team yet?

As students continue to use the graffiti sheets, they are helping me to see new ways to support a study team. Finding those common threads and building upon them with each study team has benefited everyone. In addition, rereading positive comments from one’s peers is a powerful way to help students feel valued as a member of the team. It also helps them to recognize their strengths and to continue to build upon them.

Creating an effective study team is imperative to everyone’s learning, but as every teacher knows, it is not an easy task. Therefore, it requires deliberate activities to help create equal status relationships within study teams. The graffiti sheet is a deliberate activity that helps foster relationships within study teams. It is a strategy that allows us to focus on things that have nothing to do with math ability, but has everything to do with inclusion within a team. Every student needs to be aware that they do not have to be a superstar in math in order to make a positive contribution to their study team. Employing the strengths of each team member collectively will enrich everyone’s mathematical experience.

Inspiring Connections
Course 1

Prelude

0.1.1 What do they have in common?
0.1.2 How can I effectively communicate with my team?
0.1.3 Is there another perspective?
0.1.4 How can I persevere through struggle?
0.1.5 How can I see this happening?
0.1.6 What patterns can I recognize?
0.1.7 What is the best strategy?
0.1.8 How does respect look?

Chapter 1

1.1 Proportions and Proportional Relationships
1.1.1 How can I determine the length?
1.1.2 How big is a million?
1.1.3 How can I predict the outcome?
1.1.4 What is your fair share?
1.1.5 How can I prove two ratios form a proportion?
1.1.6 What is the relationship between the numbers?
1.2 Integer Operations
1.2.1 How can I change temperatures?
1.2.2 How can I show my thinking?
1.2.3 How can adding zero help?
1.2.4 How can I multiply integers?
1.2.5 How can I divide integers?
1.2.6 How can I compose numbers?
1.2.7 What is My Number?
1.3 Proportions and Graphs
1.3.1 How can a graph tell a story?
1.3.2 How do graphs, scale, and proportions connect?

Chapter 2

2.1 Fraction and Decimal Conversions
2.1.1 How can I rewrite it?
2.1.2 How do I write it?
2.1.3 Which representations are equivalent?
2.2 Probability
2.2.1 Is it likely or unlikely?
2.2.2 How can I represent probability as a fraction, decimal, and percent?
2.2.3 How does probability work in real-world situations?
2.2.4 How can I predict the theoretical probability using experimental data?
2.3 Scale Drawings
2.3.1 How can I determine the distance?
2.3.2 How can I enlarge a shape?
2.3.3 Does that look right?
2.3.4 Is it a scaled copy?
2.3.5 What is the best scale?
2.4 Cross Sections
2.4.1 What do I see when I slice a three-dimensional object?
2.4.2 How are cross sections and volume related?

Chapter 3

3.1 Proportional Relationships
3.1.1 How does it grow?
3.1.2 How does the money grow?
3.1.3 Is this a proportional relationship?
3.1.4 How can I create a graph?
3.1.5 What do the points mean?
3.1.6 What connections can I make?
3.2 Data and Statistics: Using Samples to Make Predictions
3.2.1 What connections can I make?
3.2.2 Which sample is more accurate?
3.2.3 Does the sample represent the population?
3.2.4 How close is my sample?
3.2.5 How are the problems related?

Chapter 4

4.1 Multiple Representations of Proportional Relationships
4.1.1 How fast can I click?
4.1.2 How can I determine which grows faster?
4.1.3 How do I see the unit rate?
4.1.4 How can I write an equation?
4.1.5 What is the better deal?
4.1.6 What impact do I have?
4.1.7 How can I calculate values more efficiently?
4.1.8 How can I convert between different units of measurement?
4.1.9 How can I make the connections?
4.2 Circumference and Area of a Circle
4.2.1 How are they proportional?
4.2.2 How much space is inside?
4.2.3 What is the formula for the area of a circle?
4.2.4 How can the formula for the area of a circle help me?

Chapter 5

5.1 Probability
5.1.1 What are the chances?
5.1.2 How can I calculate the probability of more than one event?
5.1.3 What if there is more than one event?
5.1.4 What if there are more than two events?
5.1.5 How can I determine all of the outcomes?
5.1.6 What if it is more complicated?
5.2 Integer Operations Continued
5.2.1 How does each operation move points on a number line?
5.2.2 How can I show division?
5.2.3 How can I calculate it?
5.2.4 How can I check my guess?

Chapter 6

6.1 Data Distributions
6.1.1 Who is steadier?
6.1.2 How different are they?
6.1.3 How do they compare?
6.1.4 Who is more efficient?
6.1.5 How can I simulate a sample?
6.2 Numerical and Algebraic Expressions
6.2.1 How can I combine them?
6.2.2 How can I rewrite an expression?
6.2.3 How can I write an expression with negatives?
6.2.4 What does zero look like?
6.2.5 How does it move?
6.3 Equivalent Expressions
6.3.1 How can I group them?
6.3.2 Are they equivalent?
6.3.3 What are the connections?

Chapter 7

7.1 Operations With Rational Numbers
7.1.1 Will the amount increase or decrease?
7.1.2 Are differences and distance the same?
7.1.3 Can I add these?
7.2 Percent Change
7.2.1 Does this represent an increase or a decrease?
7.2.2 How does this change the total?
7.2.3 How is the money split?
7.2.4 Do I pay more?
7.3 Percents in the Real World
7.3.1 Is this good for business?
7.3.2 How much did it change?
7.3.3 Is this acceptable?
7.3.4 How are percents represented in expressions?
7.3.5 Which is easier, calculating with fractions or decimals?

Chapter 8

8.1 Multiplication and Division of Rational Numbers
8.1.1 Is the product positive or negative?
8.1.2 How are multiplication and division connected?
8.1.3 What is the relationship?
8.1.4 How can I divide?
8.1.5 How do I solve it?
8.2 Working With Expressions
8.2.1 Which is greater?
8.2.2 How can I record my work?
8.2.3 What happens when the comparison depends on x?

Chapter 9

9.1 Angle Relationships
9.1.1 How can I draw an angle?
9.1.2 How can I combine angles?
9.1.3 How can I calculate the measure of a missing angle?
9.2 Triangle Creation
9.2.1 How can I put angles and lengths together?
9.2.2 Will these lengths make a triangle?
9.2.3 How many triangles? 9.2.4 Can I construct it?
9.3 Volume and Surface Area
9.3.1 How much material do I need?
9.3.2 How do I calculate the surface area and volume?
9.3.3 How much will it hold?
9.3.4 What am I measuring?

Chapter 10

10.1: Explorations and Investigations
10.1.1 How can I make 0?
10.1.2 What number properties pair well?
10.1.3 How can you place algebraic expressions on the number line?
10.1.4 How can I solve it?
10.1.5 What can you say about the sums of consecutive numbers?
10.2: Restaurant Math
10.2.1 How can you draw it to scale?
10.2.2 How can you calculate the cost?
10.2.3 What do portions have to do with proportions?
10.2.4 What markdown undoes a markup?

Inspiring Connections
Course 2

Prelude

0.1.1

Who are my classmates?

0.1.2

How do I work collaboratively?

0.1.3

What questions can I ask?

0.1.4

How can I categorize my words?

0.1.5

How can I communicate my ideas?

0.1.6

How can the team build this together?

0.1.7

What do we need to work togethe


Chapter 1

1.1 Numbers and Data

1.1.1 How should data be placed on this line?

1.1.2 Where do these numbers belong on this line?

1.1.3 How can I use two lines to solve problems?

1.1.4 How can data be used to answer a question?

1.1.5 How are histograms helpful?

1.1.6 How else can data be displayed?

1.2 Shapes and Area,

1.2.1 How can I write equivalent expressions in area and perimeter?

1.2.2 What shapes make up the polygon?

1.2.3 How can I make it a rectangle?

1.3 Expressions

1.3.1 How can I describe it using symbols?

1.3.2 What are the parts of an expression?

1.3.3 How do I work with decimals?

1.3.4 How do I multiply multi-digit decimals?

1.3.5 How can I represent the arrangement?

Chapter 2

2.1 Ratio Language

2.1.1 How can I compare two quantities? 

2.1.2 How can I write ratios?

2.1.3 How can I see ratios in data representations?

2.2 Equivalent Ratios

2.2.1 How can I visualize ratios?

2.2.2 How can I see equivalent ratios in a table?

2.2.3 How can I see equivalent ratios in a double number line?

2.2.4 How can I see equivalent ratios in tape diagrams?

2.2.5  How can I use equivalent ratios?

2.2.6 What do these represent?

2.3 Measurement

2.3.1 What are the measurements?

2.3.2 What are the units?

2.3.3 How can I convert units

Chapter 3

3.1 Measures of Center 

3.1.1 How can I measure the center?

3.1.2 How else can I measure the center?

3.1.3 Which is the better measure of center?

3.1.4 What happens when I change the data?

3.2 Integers

3.2.1 What numbers do I see?

3.2.2 What number is this?

3.2.3 What does a number line say about a number?

3.2.4 How do I compare different types of numbers?

3.3 Absolute Value

3.3.1 How do I describe the location?

3.3.2 How far do I walk?

3.3.3 Which one is greater?

3.3.4 How do I communicate mathematically?


3.4 Coordinate Plane

3.4.1 How can you precisely indicate a location?

3.4.2 What is the correct order?

3.4.3bWhat symbol represents me?

Chapter 4

4.1 Fractions, Decimals, and Percents
4.1.1 How can I tell if the ratios are equal?
4.1.2 What does “percent” mean?
4.1.3 How can I convert a fraction?
4.1.4 How can I convert a percent?
4.1.5 How can I convert a decimal?

4.2 Percents 4.2.1 How can I show it?
4.2.2 What can I learn from the label?
4.2.3 Are the percents fair?
4.3 Unit Rates in Tables and Graphs 4.3.1 How can I compare rates?
4.3.2 Which rate is better?
4.3.3 Which deal is best?
4.3.4 What is the unit rate?
4.3.5 How can I use different data representations?

Chapter 5

5.1 Variation in Data
5.1.1 How do I ask a statistical question?
5.1.2 What does each representation say about the data?
5.1.3 What does the box in a box plot represent?
5.1.4 How else can I describe data?

5.2 Area
5.2.1 What is the height?
5.2.2 Can I reconfigure a parallelogram into a rectangle?
5.2.3 How do I calculate the area?
5.2.4 How many triangles do I need?
5.2.5 What is my perspective?
5.2.6 Is it fair to play by the rules?
5.2.7 What shapes do I see?

5.3 Fractions
5.3.1 How can I represent fraction multiplication?
5.3.2 How can I multiply fractions?
5.3.3 How can I multiply mixed numbers?

Chapter 6

6.1 Rules of Operations
6.1.1 What does it mean?
6.1.2 What do mathematicians call this?
6.1.3 How much should I ask for?
6.1.4 How can I write mathematical expressions?
6.1.5 How do mathematicians abbreviate?
6.1.6 In what order should I evaluate?

6.2 Multiples and Factors
6.2.1 When will they be the same?
6.2.2 What are multiples?
6.2.3 What do they have in common?
6.2.4 Who is your secret valentine?
6.2.5 How can I understand products?
6.2.6 How can I rewrite expressions?
6.2.7 Which method do I use?

Chapter 7

7.1 Whole Number and Decimal Division
7.1.1 How can I share equally?
7.1.2 Which strategy is the most efficient?
7.1.3 How can I write the number sentence?
7.1.4 How can I divide decimals?
7.1.5 How should the problem be arranged?

7.2 Fraction Division
7.2.1 What if the divisor is a fraction?
7.2.2 How many fit?
7.2.3 How can I visualize this?
7.2.4 What is common about this?
7.2.5 How can I use a Giant One?
7.2.6 Which method is most efficient?

Chapter 8

8.1. Algebra Tiles
8.1.1 What do these shapes represent?
8.1.2 What does a group of tiles represent?
8.1.3 What is an equivalent expression?
8.1.4 Which terms can be combined?
8.1.5 What do the numbers mean?
8.1.6 What can a variable represent?

8.2 Expressions
8.2.1 How can I count it?
8.2.2 What if the size of the pool is unknown?
8.2.3 How can I use an algebraic expression?

8.3 Equations and Inequalities
8.3.1 Which values make the equation true?
8.3.2 How can patterns be represented?
8.3.3 What is the equation?
8.3.4 How many could there be?

Chapter 9

9.1 Equations and Inequalities Continued
9.1.1 When is the statement true?
9.1.2 How do I undo that?
9.1.3 How can I visualize an equation?
9.1.4 How can I solve an equation?
9.1.5 How can I make the unknown known?
9.1.6 How can I include all the solutions?
9.1.7 Which method should I use?
9.2 Rate Problems
9.2.1 How much does rice cost?
9.2.2 How long will it take?
9.2.3 How can I compare them?
9.2.4 How long will the race take?
9.2.5 How can I represent the rate?

Chapter 10

10.1: Explorations and Investigations
10.1.1 How can I make 0?
10.1.2 What number properties pair well?
10.1.3 How can you place algebraic expressions on the number line?
10.1.4 How can I solve it?
10.1.5 What can you say about the sums of consecutive numbers?
10.2: Restaurant Math
10.2.1 How can you draw it to scale?
10.2.2 How can you calculate the cost?
10.2.3 What do portions have to do with proportions?
10.2.4 What markdown undoes a markup?

Chapter 11

11.1: Ratios and Proportions
11.1.1 How much food is there?
11.1.2 How much do we need?
11.1.3 How much is that?
11.1.4 How can I redesign the classroom?
11.2: The Number System
11.2.1 Can I determine all the right measurements?
11.2.2 How can I show my understanding?

Inspiring Connections
Course 3

Prelude

0.1.1 What can I learn from my classmates?
0.1.2 How can shapes move?
0.1.3 What does respect mean to me?
0.1.4 What story might this represent?
0.1.5 Do all cities value parks the same?
0.1.6 How can I contribute to my team?

Chapter 1

1.1 Data and Graphs
1.1.1 How can I represent data?
1.1.2 How can I use data to solve a problem?
1.1.3 Is the roller coaster safe?
1.1.4 Is there a relationship?
1.1.5 What is the relationship?

1.2 Introduction to Transformations
1.2.1 How can I move a figure on the coordinate plane?
1.2.2 How can I describe the steps precisely?
1.2.3 Is there another way?
1.3 Linear Relationships
1.3.1 How can I graph a proportional relationship?
1.3.2 How do they compare?
1.3.3 Can I graph myself?
1.3.4 How can I represent this with a graph?
1.3.5 How can I graph a linear relationship?

Chapter 2

2.1 Rigid Transformations
2.1.1 How can I describe it?
2.1.2 How does reflection affect coordinates?
2.1.3 What can I create?
2.2 Similarity
2.2.1 What if I multiply?
2.2.2 How do shapes change?
2.2.3 What can I say about dilated shapes?
2.2.4 Are they similar?
2.2.5 How can I move a shape on a coordinate plane?
2.3 Graphing Systems of Equations
2.3.1 Where do the lines cross?
2.3.2 Will different tile patterns ever have the same number of tiles?

Chapter 3

3.1 Trend Lines
3.1.1 Are these variables related?
3.1.2 Which line fits the data well?
3.1.3 How can this association be explained?
3.2 Solving Equations with Algebra Tiles
3.2.1 How can I represent an expression?
3.2.2 How can I rewrite an expression?
3.2.3 How can I compare two expressions?
3.2.4 How can I solve the equation?
3.3 Graphing Linear Equations
3.3.1 What is the rule?
3.3.2 How can I make a prediction?
3.3.3 What is a graph and how is it useful?
3.3.4 How should I graph?
3.3.5 What observations can I make about a graph?

Chapter 4

4.1 Exponents, Part 1
4.1.1 What is exponential growth?
4.1.2 How can you (re)write it?
4.1.3 How can notation help you make sense of exponential expressions?
4.1.4 Are there other exponent properties?
4.1.5 How can I prevent common exponential expression errors?
4.2 Solving Equations
4.2.1 How can I check my answer?
4.2.2 Is there always a solution?
4.2.3 How many solutions are there?
4.2.4 How can I solve complicated equations?
4.2.5 How can I write an equation to meet the criteria?
4.3 Exponents, Part 2
4.3.1 What if the exponent is not positive?
4.3.2 How do you know which exponent properties to use?

Chapter 5

5.1 Representations of a Line
5.1.1 What is the connection?
5.1.2 How can you show it?
5.1.3 How does it grow?
5.1.4 How is the growth represented?
5.1.5 How can I write the rule?
5.1.6 How can you make connections?
5.1.7 How can you use growth?
5.1.8 What are the connections?
5.2 Graphs & Equations of Systems
5.2.1 How can I change it to y = mx + b form?
5.2.2 How can I eliminate fractions and decimals in equations?
5.2.3 How do I change the line?
5.2.4 Is the intersection significant?
5.2.5 What is the equation?

Chapter 6

6.1 Solving Systems Algebraically
6.1.1 Where do the lines intersect?
6.1.2 When are they the same?
6.1.3 What if the equations are not in y = mx + b form?
6.1.4 How many solutions are there?
6.2 Slope & Rate of Change
6.2.1 What is the equation of the line?
6.2.2 How does y change with respect to x?
6.2.3 When is it the same?
6.2.4 What’s the point?
6.2.5 Can I connect rates to slopes?
6.3 Associations
6.3.1 What is the equation for a trend line?
6.3.2 How can I use an equation?
6.3.3 What if the data is not numerical?
6.3.4 Is there an association?

Chapter 7

7.1 Angles
7.1.1 How are the angles related?
7.1.2 Are there other congruent angles?
7.1.3 What about the angles in a triangle?
7.1.4 What if the angle is on the outside?
7.1.5 Can angles show similarity?
7.2 Right Triangle Theorem
7.2.1 Can I make a right triangle?
7.2.2 What is special about a right triangle?
7.2.3 How can I calculate the side length?
7.2.4 What kind of number is it?
7.2.5 How can I use the Right Triangle Theorem to Solve Problems?
7.2.6 How can I determine lengths in three dimensions?
7.2.7 How can I prove it?

Chapter 8

8.1Introduction to Functions


8.1.1

How can you (de)code the message?


8.1.2

How can a graph tell a story?


8.1.3

What can you predict?


8.1.4

Which prediction is best?


8.1.5

How does the output change based on the input?


8.1.6

How do you see the relationship?

8.2

 Characteristics of Functions


8.2.1

What is a function?


8.2.2

How can you describe the relationship?


8.2.3

How do I sketch it?


8.2.4

How many relationships are there?

8.3

Linear and Nonlinear Functions


8.3.1

Is it linear or nonlinear?


8.3.2

What clues do ordered pairs reveal about a relationship?


8.3.3

What other functions might you encounter?

Chapter 9

9.1Volume


9.1.1

Given the volume of a cube, how long is the side?


9.1.2

What if the base is not a polygon?


9.1.3

What if the layers are not the same?


9.1.4

What if it is oblique?


9.1.5

What if it is a three-dimensional circle?

9.2

Scientific Notation


9.2.1

How can I write very large or very small numbers?


9.2.2

How do I compare very large numbers?


9.2.3

How do I multiply and divide numbers written in scientific notation?


9.2.4

How do I add and subtract numbers written in scientific notation?


9.2.5

How do I compute it?

9.3

Applications of Volume


9.3.1

What does a volume function look like?


9.3.2

What is the biggest cone?


9.3.3

How do all the items fit together?

Chapter 10

10.1Explorations and Investigations


10.1.1

How close can I get?


10.1.2

Can you make them all?


10.1.3

How many triangles will there be?


10.1.4

What’s my angle?


10.1.5

Function-function, what’s your function?


10.1.6

Is it always true?


10.1.7

What’s right?


10.1.8

What’s your story?

You are now leaving cpmstg.wpengine.com.

Did you want to leave cpmstg.wpengine.com?

I want to leave cpmstg.wpengine.com.

No, I want to stay on cpmstg.wpengine.com

Algebra Tiles Blue Icon

Algebra Tiles Session

  • Used throughout CPM middle and high school courses
  • Concrete, geometric representation of algebraic concepts.
  • Two-hour virtual session,
  •  Learn how students build their conceptual understanding of simplifying algebraic expressions
  • Solving equations using these tools.  
  • Determining perimeter,
  • Combining like terms,
  • Comparing expressions,
  • Solving equations
  • Use an area model to multiply polynomials,
  • Factor quadratics and other polynomials, and
  • Complete the square.
  • Support the transition from a concrete (manipulative) representation to an abstract model of mathematics..

Foundations for Implementation

This professional learning is designed for teachers as they begin their implementation of CPM. This series contains multiple components and is grounded in multiple active experiences delivered over the first year. This learning experience will encourage teachers to adjust their instructional practices, expand their content knowledge, and challenge their beliefs about teaching and learning. Teachers and leaders will gain first-hand experience with CPM with emphasis on what they will be teaching. Throughout this series educators will experience the mathematics, consider instructional practices, and learn about the classroom environment necessary for a successful implementation of CPM curriculum resources.

Page 2 of the Professional Learning Progression (PDF) describes all of the components of this learning event and the additional support available. Teachers new to a course, but have previously attended Foundations for Implementation, can choose to engage in the course Content Modules in the Professional Learning Portal rather than attending the entire series of learning events again.

Edit Content

Building on Instructional Practice Series

The Building on Instructional Practice Series consists of three different events – Building on Discourse, Building on Assessment, Building on Equity – that are designed for teachers with a minimum of one year of experience teaching with CPM instructional materials and who have completed the Foundations for Implementation Series.

Building on Equity

In Building on Equity, participants will learn how to include equitable practices in their classroom and support traditionally underserved students in becoming leaders of their own learning. Essential questions include: How do I shift dependent learners into independent learners? How does my own math identity and cultural background impact my classroom? The focus of day one is equitable classroom culture. Participants will reflect on how their math identity and mindsets impact student learning. They will begin working on a plan for Chapter 1 that creates an equitable classroom culture. The focus of day two and three is implementing equitable tasks. Participants will develop their use of the 5 Practices for Orchestrating Meaningful Mathematical Discussions and curate strategies for supporting all students in becoming leaders of their own learning. Participants will use an equity lens to reflect on and revise their Chapter 1 lesson plans.

Building on Assessment

In Building on Assessment, participants will apply assessment research and develop methods to provide feedback to students and inform equitable assessment decisions. On day one, participants will align assessment practices with learning progressions and the principle of mastery over time as well as write assessment items. During day two, participants will develop rubrics, explore alternate types of assessment, and plan for implementation that supports student ownership. On the third day, participants will develop strategies to monitor progress and provide evidence of proficiency with identified mathematics content and practices. Participants will develop assessment action plans that will encourage continued collaboration within their learning community.

Building on Discourse

In Building on Discourse, participants will improve their ability to facilitate meaningful mathematical discourse. This learning experience will encourage participants to adjust their instructional practices in the areas of sharing math authority, developing independent learners, and the creation of equitable classroom environments. Participants will plan for student learning by using teaching practices such as posing purposeful questioning, supporting productive struggle, and facilitating meaningful mathematical discourse. In doing so, participants learn to support students collaboratively engaged with rich tasks with all elements of the Effective Mathematics Teaching Practices incorporated through intentional and reflective planning.