To be successful in learning math, students need to develop the following learning habits.
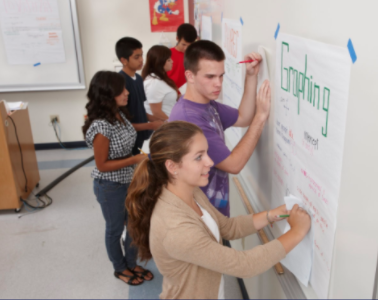
During class, your student will often be working in a small group called a study team. Study teams are designed to encourage students to engage in mathematical conversations. Collaboration allows students to develop new ways of thinking about mathematics, practice communicating with others about math, and strengthen their understanding of concepts and ideas as they explain their thinking to others. Each student in a study team has an assigned role with a clear set of expectations, which are listed in the student text.
Below are lists of additional questions to use when working with your student. These questions do not refer to any particular concept or topic. Some questions may or may not be appropriate for some problems. Click on each topic to view the questions.
This is certainly not a complete list; you will probably come up with some of your own questions as you work through the problems with your student. Ask any question at all, even if it seems too simple to you.
We believe all students can be successful in mathematics as long as they are willing to work and ask for help when they need it. We encourage you to contact your student’s teacher if your student has additional questions that this guide or other resources do not answer.
A good place to start when assisting a student with CPM mathematics is with the Parent Guide for the course your student is enrolled in. Download a copy of the Parent Guide located in your student’s CPM eBook under Student Support within the Reference Tab at the left. Once in Student Support, select Parent Guide at the top menu.
Welcome to College Preparatory Mathematics, CPM. Your child will be involved in interesting and stimulating mathematics this school year. To help you understand what is happening in your child’s math class, you will be receiving a Tip of the Week.
CPM believes that all students can be successful in mathematics as long as they are willing to work and ask for help when they need it. We encourage you to contact your child’s teacher whenever you or your child have questions.
During class your child will often be working in a small group called a study team. Study teams are designed to encourage students to engage in mathematical conversations. These conversations allow students to develop new ways of thinking about mathematics, increase their abilities to communicate with others about math, and help strengthen their understanding of concepts and ideas as they explain their thinking to others. Each student in the study team has an assigned role with a clear set of expectations, which are listed in the student text and reinforced often by the teacher.
Because students are expected to work together to solve problems, the main role of the teacher is to pose the big problems and then to be a supporting guide during the solution process. Instead of just demonstrating a process and having students mimic it, your child’s teacher will introduce the concept of the day and then circulate through the classroom, listening to team discussions, asking questions of teams and students, working with the teams as they solve the problems, and initiating a closure activity at the end of each lesson to ensure that the mathematics has been summarized.
The main objectives of Chapter 1 are to introduce the course to the students, allow them to apply previous learning in new ways, and review ideas from previous math courses. You will notice boxes titled “Math Notes”. Math Notes boxes contain definitions, explanations, and/or examples. Your child’s teacher will explain how these notes will be used in class.
The homework is in a section titled “Review and Preview”. Each Review and Preview section consists of six to ten problems on a variety of topics and skills. Known as interleaving, this mixed spaced practice approach for homework leads to higher learning and better long–term retention.
CPM offers resources for parents and students within the student edition eBooks. In your student’s eBook, select “Reference” from the bottom of the left-hand menu. Then select “Student Support” and select the appropriate tabs at the top. You might find it useful to take a look at the following sections:
In the Reference section, there are suggestions of ways to help your student, parent guides to lessons, and tips for learning. If you have questions about CPM, an excellent resource is in Helping Your Student by Asking Questions section.
Communication between parents and the teacher is important for student success. If you have not already had an open house or back-to-school night at your school, you might want to contact your student’s teacher to open the channels of communication. You can support the teacher and your student by:
Practice and discussion are required to understand concepts in mathematics. When your child comes to you with a question about a homework problem, often you may simply need to ask them to read the problem aloud, and then ask what the problem is about. When you are working problems together, have your child talk about the problems, stating their thinking as they work. Remember to have your child practice on their own too.
Below is a list of general questions you can ask your child to help if they get stuck:
If your child has made an attempt at starting the problem, try these questions.
If your child does not seem to be making any progress, you might try these questions.
Be sure to include other appropriate questions. Remind them to use the index, glossary, Checkpoint materials, homework help, Math Notes boxes, and their Learning Logs. All are useful tools in the process of learning.
Mistakes are an important step in the process of learning. Don’t let your student give up when they make one! Encourage your student to persevere, try another strategy, think outside the box, or talk problems over with someone. Sometimes it is hard to watch our students make mistakes, but struggling helps brains grow and for your student to become smarter and more resilient. Very successful people often report that many mistakes were made along the way to their success, and these mistakes were an important and much overlooked part of the journey. Your student does not need to be fast at math, so speed should not be a goal. They just need to think deeply about it. This should also be the goal when responding to math questions. Encourage your student to think about his answer. Does it make sense? (Paraphrased from Jo Boaler)
By this time in the school year, your student may have taken a team test at some point before taking an individual test. Team tests provide students an opportunity to check their depth of understanding through collaborative problem solving. They also help teachers identify general areas of concern that need to be addressed prior to the individual test. Students who take notes during the team test process, who ask follow-up questions during class discussions, and who correct their test often experience dramatic improvements on individual tests.
There are several types of problems your child sees when doing classwork and homework. Classwork problems have been designed to encourage students to work together with their teammates to solve interesting and engaging problems (with teacher support). At times, these problems require students to use previous learning. Some problems will require the use of manipulatives, such as blocks, number cubes, Algebra Tiles, or models to help develop understanding. Other problems introduce students to new ideas. All of the problems have been carefully constructed to further a student’s understanding of mathematics.
The homework problems are both for review and preview. Often the first problem or two will cover the work that was done in class that day. Then there are problems that review concepts from previous courses or lessons. There are also problems that are designed to prompt students to think about a mathematical idea that will be introduced in a future lesson. If your child is struggling with homework, suggest that they check the CPM online Homework Help and other resources found at www.cpm.org
Your student may have told you about working with new team members. In a student-centered classroom, teachers have students change teams periodically. This allows students to collaborate with others. Research has shown that students who work in a collaborative problem-solving situation show higher achievement, increased retention, greater intrinsic motivation, higher self-esteem, and a better attitude toward teachers and school, to name a few. If you would like further information about team work, it can be found at Synthesis of Research (PDF).
There will be some topics that your child understands quickly and some concepts that may take longer to master. Big ideas take time to learn. This means that students are not necessarily expected to master a concept when it is first introduced. When a topic is first introduced, there will be several practice problems to do. Succeeding lessons and homework assignments will continue to practice the concept or skill over weeks and months so that mastery will develop over time and long-term learning will occur.
If your child still needs extra practice on some topics, either current or previously learned, make sure that you go to the cpm.org website and look for Parent Guides and Extra Practice under Textbook Resources. You can select the current or past course and look at the table of contents to find the topics you need. You will also find the Checkpoint problems there. They are also useful for review and practice of concepts.
To be successful in mathematics, students need to develop the ability to reason mathematically. To do so, students need to think about what they already know and then connect this knowledge to the new ideas they are learning. Many students are not used to the idea that what they learned yesterday or last week will be connected to today’s lesson. When students understand that connecting prior learning to new ideas is a normal part of their education, they will be more successful in mathematics. Your child can maximize their learning by:
Ask your student to teach you some math that they feel they have mastered or are particularly proud of. Or ask your student to show you some class work from last week. This will give them an opportunity to feel proud of their work, and it will give you an opportunity to assist in your student’s learning. By giving your student the opportunity to explain their thinking, you are encouraging them to be more confident, use new vocabulary, and identify any confusion they may have. Also, by explaining their thinking to someone else, they are making that knowledge clearer for themselves.
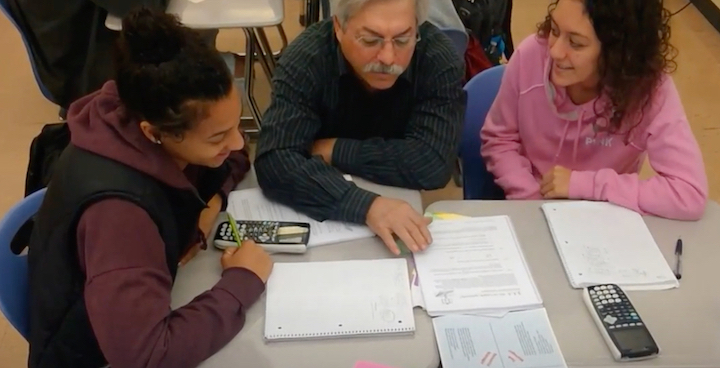
If you were to visit a CPM classroom, you would see the teacher doing more than standing in front of the class, telling students what they should know. After reading the objectives of what will be learned that day, the students would be asked to begin the lesson by connecting to what they already know. As the students interact with the others in their team, the teacher circulates throughout the classroom. During this time, the teacher listens to the discussions in the teams, asks clarifying questions, and ensures that everyone is on task. If there seems to be class confusion about a problem, the teacher may stop the class and spend a few minutes clarifying. Near the end of class, there may be brief student presentations. There will also be a closure activity which will help summarize the activity and may inform the teacher of the depth of student understanding at the end of class.
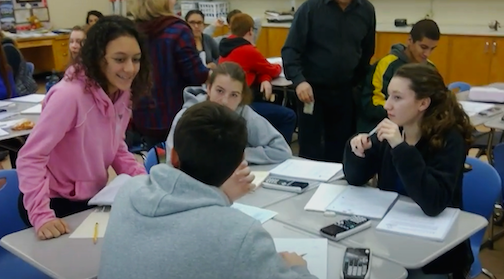
This week would be a good time to revisit the three videos that are available in the Learning with Study Teams section. The first video is about the CPM program. The second video shows students discussing study team guidelines. Interactions between study team members is the topic of the third video. All three will provide you with a snapshot of a CPM classroom in action.
As you may have seen in the videos from an earlier Tip, the role of the student has changed. Instead of listening to the teacher lecture and explain the mathematics for most of the period, the students do most of the sense–making and talking about the math. They explain their thinking about a problem to their teammates and to the teacher, when asked. An effective team allows everyone an opportunity to ask questions and explain their ideas. They listen to one another. Toward the end of class, students might be asked to explain to the rest of the class what learning has taken place. The teacher’s responsibility is to see that all students are engaged, involved, supported, and moving forward in their understanding of the concepts and skills of the course. A teacher will check for understanding throughout the lesson but also at the end of the lesson so they know how to plan for upcoming lessons.
While working on the mathematics lesson, each student has a team-related job. The Resource Manager seeks input from each person and then calls the teacher over to ask a team question. The Facilitator begins the team discussion and keeps everyone involved in the discussion. The Recorder/Reporter shares the team’s findings with the class, makes sure that everyone knows what to write down, and encourages agreement. The Task Manager keeps everyone focused on the problem, listens for reasons, and asks for justification from team members. Some teachers might vary the responsibilities of the different roles from time to time. Ask your student what their role is this week.
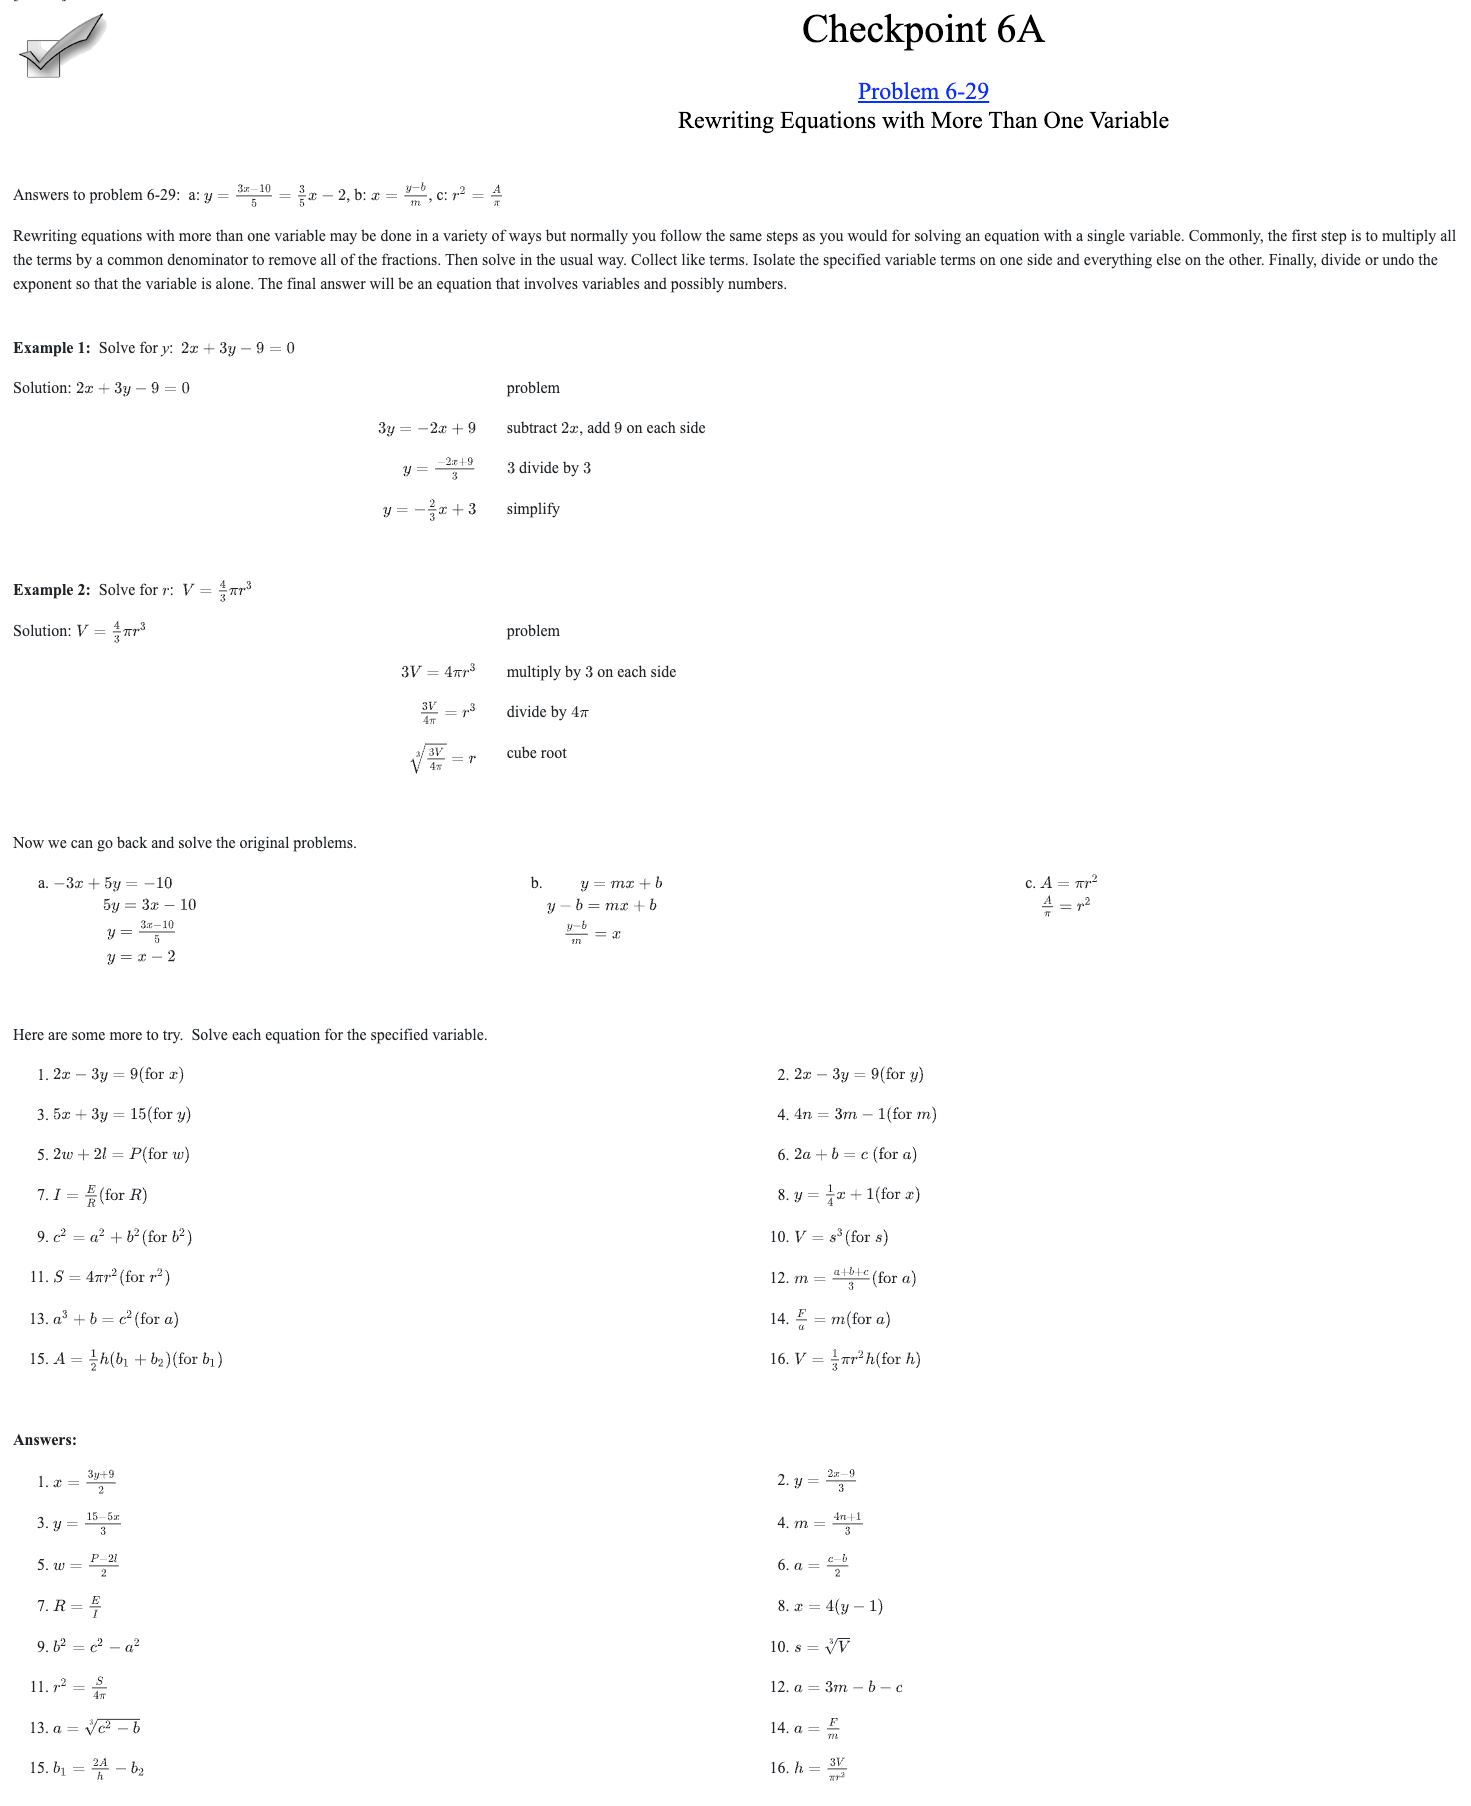
In each chapter, there is one or more topics that are identified as a Checkpoint skill. It is a skill that students should have mastered or be close to mastering when they reach that problem in the book. It is marked in the book with a graphic check mark. The answers to the Checkpoint problems are in the Checkpoint Materials at the back of the book where you will also find more examples and more practice problems. In the eBook, students can find Checkpoint Materials under the Reference tab → Checkpoints. You can look at the unit your student is in now to find the Checkpoint Problem(s) for that unit.
You might have read about a growth mindset versus a fixed mindset. When mentioned in a math context, the common question is: Can everyone learn math or are some people “just good at it”? Recent research shows that a student with a growth mindset is a flexible learner. Even students who don’t appear to have strong skills in an area can become very proficient if they can develop a growth mindset towards a topic. A student with a growth mindset will take on challenges, learn from mistakes, accept feedback and criticism, practice and apply strategies to accomplish goals, persevere, ask questions, and take risks. As a result, they reach ever-higher levels of achievement. A student with a fixed mindset won’t. The fixed mindset learner thinks that one’s character, intelligence, and creative ability can’t be changed in any meaningful way. As a result, the fixed mindset learner may plateau early and achieve less than their full potential. There is a mixed mindset where a student is moving from a fixed mindset to a growth mindset. Observe your child to see what mindset characteristics they exhibit. For more information about this, go to www.mindsetworks.com. Carol Dweck, a professor at Stanford University, says that we are in charge of our own growth. We can choose to change our mindset and reach our potential. Another source of information about growth mindset can be found at Carol Dweck – Mindset
.
CPM teachers use many strategies to encourage students to work together successfully. Most strategies have students talking about the mathematics, and some use writing as a way to communicate. Some of the strategies include movement around the classroom. Movement is very important as it helps the students’ brains to grow. Ask your student to share how they participated during an activity that involved a team or teaching strategy.
Assessment in a CPM classroom is happening continuously. The teacher assesses student understanding as they circulate the classroom while teams are working. The in-tune teacher can learn a great deal by listening to the students’ discussion of the mathematics. At the end of class, students will be asked to do one of several closure activities. Sometimes the closure activity might be writing about what was learned that day. Sometimes teachers will have teams display their work in the classroom and the students do a Gallery Walk. During this activity, students view and discuss the work done by other teams.
The kind of assessment a teacher is doing in these situations is called Formative Assessment or Assessment for Learning. By listening and watching carefully and asking questions, the teacher is able to determine at what level the students are understanding the material. The teacher then knows when to bring the class together to clarify a misunderstanding that may be occurring in more than one team. Or, they may see that one team can be pushed to try a deeper challenge while another needs to back up and revisit an earlier part of the problem with some help. This kind of assessment will help a teacher know what students know and what they don’t know.
You might hear or read about “differentiating instruction.” This refers to the process of adjusting lessons to best meet students’ needs. In the CPM program instruction is differentiated by the way students approach problems. Theorist Jerome Bruner states that the ideal progression of activities for learners is to go through the enactive stage (this would be using concrete materials — integer tiles, algebra tiles, models including computer-generated ones, etc.), then the iconic stage, in which students draw pictures or use mental imagery developed from their experience with the concrete materials, and then move to the use of symbols to represent the concrete. In a CPM classroom, students are allowed to move on to the iconic and then the symbolic stage when they are ready, while the physical models remain available for those who need them.
In recent years, there has been a significant amount of research on the brain and student learning. Here are some tidbits about the brain, from Eric Jensen’s Teaching with the Brain in Mind:
Information and memories are stored in different parts of the brain and have different durations. Short-term memory lasts approximately 30 seconds, while working memory lasts up to 20 minutes and long-term memory can last much longer if what was learned is practiced. Because we want learning to become long term, we need to know how to move information into long-term memory. Content must be understood and have meaning. In order to retrieve information accurately and completely, we must look at how it is stored in the first place, not how we access it later. Sometimes we can improve our later recall of information by doing a cross-lateral movement at the time that we learn it. One way of doing this is tugging on the left ear with the right-hand. This research is significant because it connects to the teaching strategies used in a CPM classroom. Interleaving topics (also known as spaced practice) and mastery over time are both substantiated by what has been learned about how the brain stores and retrieves information. For more information about brain-based learning go to the Brain-based learning article.
This week would be a good time to check your student’s classwork and homework. It should be neat, complete, and easy to understand. Ask them to explain one of the problems they have recently done in class that they enjoyed doing. If the work is incomplete or difficult for you to read, you might want to check the work more often or talk to your student’s teacher for additional ideas on how to help.
As many states transition into the Common Core State Standards for Mathematics (CCSSM), you might be hearing a lot about what this could mean for your child. The CCSSM content standards were written so that there is consistency of what children are learning across the country. These standards began with research-based learning progressions on students’ mathematical development. They concentrate on a clear set of mathematical skills and concepts, and encourage students to solve real-world problems like the ones your child is encountering in their math class. Remember though, that standards tell teachers what needs to be covered. Standards are not textbooks, nor do they tell teachers how to teach something. For more information about CCSS go to www.corestandards.org/Math/.
Whether your state has adopted the CCSSM or not, there is a lot more to the CCSSM than the content standards. The CCSSM also contain the Standards for Mathematical Practice. Although they are often just referred to as the “math practices,” these are really just best practices in teaching. The math practices describe the behaviors that would be expected in successful mathematics students. For more information on the practices and their implementation, follow this link: Resources – Supporting the Math Practices.
Listed below are the eight Standards for Mathematical Practice. Read this list and see if you would like your child to do these things. These practices will be addressed in more detail in the upcoming tips.
The Standards for Mathematical Practice are:
Standard 1: Make sense of problems and persevere in solving them.
Standard 2: Reason abstractly and quantitatively.
Standard 3: Construct viable arguments and critique the reasoning of others.
Standard 4: Model with mathematics
Standard 5: Use appropriate tools strategically.
Standard 6: Attend to precision.
Standard 7: Look for and make use of structure.
Standard 8: Look for and express regularity in repeated reasoning.
In Week 24, we listed the Common Core State Standards for Mathematical Practices. The first one was Make sense of problems and persevere in solving them.
Mathematically proficient students find meaning in problems. They look for entry points, analyze, conjecture, and plan solution pathways. The students monitor and adjust their work and verify answers. They ask themselves the question “Does this make sense?”
Where have you seen examples of opportunities for your child to make sense of problems and persevere in finding a solution in their math work this year? Observe your child while they are doing homework. Do they work thoughtfully or are they just trying to get finished as quickly as possible? Do they look back to see if the answer makes sense in terms of the question, or are they simply satisfied to have any answer? By encouraging students to develop the practice of looking for meaning in every problem, we can significantly improve their performance. Finding meaning is what mathematics is all about!
In Week 23, we listed the Standards for Mathematical Practices. The third standard is to Construct viable arguments and critique the reasoning of others.
Mathematically proficient students understand and use information to construct arguments. They make and investigate conjectures. They can recognize and use counterexamples. They justify their conclusions, communicate them to others, and respond to the arguments of others. Students at all grades can listen or read the arguments of others, decide whether they make sense, and ask useful questions to clarify or improve the arguments. How has working with a team helped your student meet this standard?
In Week 23, we listed the Standards for Mathematical Practices. Model with mathematics is the fourth standard.
Mathematically proficient students can apply mathematics to solve problems in everyday life. They can make assumptions and approximations to simplify a complicated situation, realizing that these may need revision later. They are able to identify important quantities in a practical situation. They routinely interpret their results in the context of the situation and reflect on whether the results make sense. Where have you seen evidence that your student has used mathematics in everyday life?
In Week 23, we listed the Standards for Mathematical Practices. The fifth standard is to Use appropriate tools strategically.
Mathematically proficient students consider the available tools when solving problems. Proficient students are familiar with tools appropriate for their grade or course (pencil and paper, concrete models, ruler, protractor, calculator, spreadsheet, computer programs, digital content located on a website, and other technological tools). They make sound decisions about when each of these tools might be helpful. They are able to use technological tools to explore and deepen their understanding of concepts. What tools has your student used this year to become mathematically proficient?
In Week 23, we listed the Standards for Mathematical Practices. The sixth standard is to Attend to precision.
Mathematically proficient students communicate clearly and precisely to others. They use clear definitions, state the meaning of the symbols they choose, and are careful about specifying units of measure, and labeling axes. They calculate accurately and efficiently. Has your student improved the ability to attend to precision?
In Week 23, we listed the Standards for Mathematical Practices. Look for and make use of structure is the seventh standard.
Mathematically proficient students look closely to discern a pattern or structure. They can step back to see an overview and shift perspective. These students see complicated things as single objects or as being composed of several objects. Ask your student to share a pattern that was recently investigated in class and describe its structure.
In Week 23, we listed the Standards for Mathematical Practices. The last standard is Look for and express regularity in repeated reasoning.
Mathematically proficient students notice if calculations are repeated and look both for general methods and for shortcuts. As they work to solve a problem, mathematically proficient students maintain oversight of the process while attending to the details. They continually evaluate the reasonableness of their intermediate results. Ask your student if they have developed a shortcut to doing some of the problems and ask them to explain it to you.
Student presentations are an ongoing part of the mathematics program. Students are expected to participate in both formal and informal presentations. Informal presentations can be done by individual students or teams. Usually they cover a problem or an idea that they investigated that day in class. The more formal presentations are usually connected to an investigation that has taken several days to complete. Both formal and informal presentations can be used to assess student understanding.
One of the main goals of CPM is to have mathematics make sense. We want students to learn to use the textbook as a resource and to gain information, not just a bunch of problems to solve. We expect students to take responsibility for their education by actively working at learning mathematics. We want students to retain information and skills and develop strong problem solving skills. One such skill is to develop a way to choose the best strategy for solving a problem. We strive to develop creative problem solvers who know how to collaborate and communicate clearly.
As the school year draws to a close, you and your student might want to reflect upon the mathematical learning that has taken place. Has your student developed more of a Growth Mindset? Are they willing to stick with a problem until they have a solution? What concepts have they mastered? Which concepts seem to be in progress? Ask your student to tell you the most memorable learnings from this year in mathematics. If your student is continuing with the CPM program, you might want to encourage them to keep their notes from this year as a reference for next year. Good luck with the remaining days of the school year and in all future endeavors.
Section 6.1
6.1.1 Rigid Transformations
6.1.2 Rigid Transformations on a Coordinate Graph
6.1.3 Describing Transformations
6.1.4 Using Rigid Transformations
Section 6.2
6.2.1 Multiplication and Dilation
6.2.2 Dilations and Similar Figures
6.2.3 Identifying Similar Shapes
6.2.4 Similar Figures and Transformations
6.2.5 Working With Corresponding Sides
6.2.6 Solving Problems Involving Similar Shapes
Chapter Closure
Section 7.1
7.1.1 Circle Graphs
7.1.2 Organizing Data in a Scatterplot
7.1.3 Identifying and Describing Association
Section 7.2
7.2.1 y = mx + b Revisited
7.2.2 Slope
7.2.3 Slope in Different Representations
7.2.4 More About Slope
7.2.5 Proportional Equations
Section 7.3
7.3.1 Using Equations to Make Predictions
7.3.2 Describing Association Fully
7.3.3 Association Between Categorical Variables
Chapter Closure
Section 8.1
8.1.1 Patterns of Growth in Tables and Graphs
8.1.2 Compound Interest
8.1.3 Linear and Exponential Growth
Section 8.2
8.2.1 Exponents and Scientific Notation
8.2.2 Exponent Rules
8.2.3 Negative Exponents
8.2.4 Operations with Scientific Notation
Section 8.3
8.3.1 Functions in Graphs and Tables
Chapter Closure
Section 9.1
9.1.1 Parallel Line Angle Pair Relationships
9.1.2 Finding Unknown Angles in Triangles
9.1.3 Exterior Angles in Triangles
9.1.4 AA Triangle Similarity
Section 9.2
9.2.1 Side Lengths and Triangles
9.2.2 Pythagorean Theorem
9.2.3 Understanding Square Root
9.2.4 Real Numbers
9.2.5 Applications of the Pythagorean Theorem
9.2.6 Pythagorean Theorem in Three Dimensions
9.2.7 Pythagorean Theorem Proofs
Chapter Closure
Section 10.1
10.1.1 Cube Roots
10.1.2 Surface Area and Volume of a Cylinder
10.1.3 Volumes of Cones and Pyramids
10.1.4 Volume of a Sphere
10.1.5 Applications of Volume
Chapter Closure
10.2.1 Indirect Measurement
10.2.2 Finding Unknowns
10.2.3 Analyzing Data to Identify a Trend
1. Operations with Signed Fractions and Decimals
2. Evaluating Expressions and Using Order of Operations
3. Unit Rates and Proportions
4. Area and Perimeter of Circles and Composite Figures
5. Solving Equations
6. Multiple Representations of Linear Equations
7. Solving Equations with Fractions and Decimals (Fraction Busters)
8. Transformations
9. Scatterplots and Association
Section 12.1
12.1.1 Sampling Distribution of the Slope of the Regression Line
12.1.2 Inference for the Slope of the Regression Line
Section 12.2
12.2.1 Transforming Data to Achieve Linearity
12.2.2 Using Logarithms to Achieve Linearity
Section 13.1
13.1.1 Modeling With the Chi-Squared Distribution
13.1.2 Introducing the F-Distribution
Section 13.2
13.2.1 One-Way ANOVA
Section 13.3
13.3.1 Sign Test: Introduction to Nonparametric Inference
13.3.2 Mood’s Median Test
Section 6.1
6.1.1 Comparing Expressions
6.1.2 Comparing Quantities with Variables
6.1.3 One Variable Inequalities
6.1.4 Solving One Variable Inequalities
Section 6.2
6.2.1 Solving Equations
6.2.2 Checking Solutions and the Distributive Property
6.2.3 Solving Equations and Recording Work
6.2.4 Using a Table to Write Equations from Word Problems
6.2.5 Writing and Solving Equations
6.2.6 Cases with Infinite or No Solutions
6.2.7 Choosing a Solving Strategy
Chapter Closure
Section 7.1
7.1.1 Distance, Rate, and Time
7.1.2 Scaling Quantities
7.1.3 Solving Problems Involving Percents
7.1.4 Equations with Fraction and Decimal Coefficients
7.1.5 Creating Integer Coefficients
7.1.6 Creating Integer Coefficients Efficiently
7.1.7 Percent Increase and Decrease
7.1.8 Simple Interest
Section 7.2
7.2.1 Finding Missing Information in Proportional Relationships
7.2.2 Solving Proportions
Chapter Closure
Section 8.1
8.1.1 Measurement Precision
8.1.2 Comparing Distributions
Section 8.2
8.2.1 Representative Samples
8.2.2 Inference from Random Samples
Section 8.3
8.3.1 Introduction to Angles
8.3.2 Classifying Angles
8.3.3 Constructing Shapes
8.3.4 Building Triangles
Chapter Closure
Section 9.1
9.1.1 Circumference, Diameter, and Pi
9.1.2 Area of Circles
9.1.3 Area of Composite Shapes
Section 9.2
9.2.1 Surface Area and Volume
9.2.2 Cross Sections
9.2.3 Volume of a Prism
9.2.4 Volume of Non-Rectangular Prisms
Chapter Closure
Section 9.3
9.3.1 Volume and Scaling
9.3.2 Using Multiple Math Ideas to Create an Interior Design
9.3.3 Applying Ratios
Checkpoint 1: Area and Perimeter of Polygons
Checkpoint 2: Multiple Representations of Portions
Checkpoint 3: Multiplying Fractions and Decimals
Checkpoint 5: Order of Operations
Checkpoint 6: Writing and Evaluating Algebraic Expressions
Checkpoint 7A: Simplifying Expressions
Checkpoint 7B: Displays of Data: Histograms and Box Plots
Checkpoint 8: Solving Multi-Step Equations
Checkpoint 9: Unit Rates and Proportions
Section 11.1
11.1.1 Area Bounded by a Polar Curve
11.1.2 More Polar Area
11.1.3 Area Between Polar Curves
Section 11.2
11.2.1 Applied Calculus in Component Form
11.2.2 Second Derivatives in Component Form
11.2.3 Total Distance and Arc Length
Section 11.3
11.3.1 Slopes of Polar Curves
11.3.2 More Slopes of Polar Curves
Section 11.4
11.4.1 Battling Robots
Section 12.1
12.1.1 Approximating with Polynomial Functions
12.1.2 Taylor Polynomials About x = 0
12.1.3 Taylor Polynomials About x = c
12.1.4 Taylor Series
12.1.5 Building Taylor Series Using Substitution
Section 12.2
12.2.1 Interval of Convergence Using Technology
12.2.2 Interval of Convergence Analytically
Section 12.3
12.3.1 Error Bound for Alternating Taylor Polynomials
12.3.2 Lagrange Error Bound
Section 12.4
12.4.1 Evaluating Indeterminate Forms Using Taylor Series
Opening | 1.OP | Chapter Opening |
---|---|---|
Section 1.1 | 1.1.1 | Visualizing Information |
1.1.2 | Perimeter and Area Relationships | |
1.1.3 | Describing and Extending Patterns | |
1.1.4 | Representing Data | |
1.1.5 | Making Sense of a Logic Problem | |
Section 1.2 | 1.2.1 | Multiple Representations |
1.2.2 | Representing Comparisons | |
1.2.3 | Characteristics of Numbers | |
1.2.4 | Products, Factors, and Factor Pairs | |
Section 1.3 | 1.3.1 | Attributes and Characteristics of Shapes |
1.3.2 | More Characteristics of Shapes | |
Closure | 1.CL | Chapter Closure |
Opening | 2.OP | Chapter Opening |
---|---|---|
Section 2.1 | 2.1.1 | Dot Plots and Bar Graphs |
2.1.2 | Histograms and Stem-and-Leaf Plots | |
Section 2.2 | 2.2.1 | Exploring Area |
2.2.2 | Square Units and Area of Rectangles | |
2.2.3 | Area and Perimeter | |
Section 2.3 | 2.3.1 | Using Rectangles to Multiply |
2.3.2 | Using Generic Rectangles | |
2.3.3 | Distributive Property | |
2.3.4 | Generic Rectangles and the Greatest Common Factor | |
Closure | 2.CL | Chapter Closure |
Opening | 3.OP | Chapter Opening |
---|---|---|
Section 3.1 | 3.1.1 | Using the Multiplicative Identity |
3.1.2 | Portions as Percents | |
3.1.3 | Connecting Percents with Decimals and Fractions | |
3.1.4 | Multiple Representations of a Portion | |
3.1.5 | Completing the Web | |
3.1.6 | Investigating Ratios | |
Section 3.2 | 3.2.1 | Addition, Subtraction, and Opposites |
3.2.2 | Locating Negative Numbers | |
3.2.3 | Absolute Value | |
3.2.4 | Length on a Coordinate Graph | |
Closure | 3.CL | Chapter Closure |
Opening | 4.OP | Chapter Opening |
---|---|---|
Section 4.1 | 4.1.1 | Introduction to Variables |
4.1.2 | Writing Equivalent Expressions | |
4.1.3 | Using Variables to Generalize | |
Section 4.2 | 4.2.1 | Enlarging Two-Dimensional Shapes |
4.2.2 | Enlarging and Reducing Figures | |
4.2.3 | Enlargement and Reduction Ratios | |
4.2.4 | Ratios in Other Situations | |
Closure | 4.CL | Chapter Closure |
Opening | 5.OP | Chapter Opening |
---|---|---|
Section 5.1 | 5.1.1 | Representing Fraction Multiplication |
5.1.2 | Describing Parts of Parts | |
5.1.3 | Calculating Parts of Parts | |
5.1.4 | Multiplying Mixed Numbers | |
Section 5.2 | 5.2.1 | Making Sense of Decimal Multiplication |
5.2.2 | Fraction Multiplication Number Sense | |
Section 5.3 | 5.3.1 | Rearranging Areas |
5.3.2 | Area of a Parallelogram | |
5.3.3 | Area of a Triangle | |
5.3.4 | Area of a Trapezoid | |
Closure | 5.CL | Chapter Closure |
Section 5.4 | Mid-Course Reflection Activities |
Opening | 6.OP | Chapter Opening |
---|---|---|
Section 6.1 | 6.1.1 | Dividing |
6.1.2 | Fractions as Division Problems | |
6.1.3 | Problem Solving with Division | |
6.1.4 | Solving Problems Involving Fraction Division | |
Section 6.2 | 6.2.1 | Order of Operations |
6.2.2 | Area of a Rectangular Shape | |
6.2.3 | Naming Perimeters of Algebra Tiles | |
6.2.4 | Combining Like Terms | |
6.2.5 | Evaluating Algebraic Expressions | |
Closure | 6.CL | Chapter Closure |
Opening | 7.OP | Chapter Opening |
---|---|---|
Section 7.1 | 7.1.1 | Comparing Rates |
7.1.2 | Comparing Rates with Tables and Graphs | |
7.1.3 | Unit Rates | |
Section 7.2 | 7.2.1 | Analyzing Strategies for Dividing Fractions |
7.2.2 | Another Strategy for Division | |
7.2.3 | Division with Fractions and Decimals | |
7.2.4 | Fraction Division as Ratios | |
Section 7.3 | 7.3.1 | Inverse Operations |
7.3.2 | Distributive Property | |
7.3.3 | Distributive Property and Expressions Vocabulary | |
7.3.4 | Writing Algebraic Equations and Inequalities | |
Closure | 7.CL | Chapter Closure |
Opening | 8.OP | Chapter Opening |
---|---|---|
Section 8.1 | 8.1.1 | Measures of Central Tendency |
8.1.2 | Choosing Mean or Median | |
8.1.3 | Shape and Spread | |
8.1.4 | Box Plots and Interquartile Range | |
8.1.5 | Comparing and Choosing Representations | |
Section 8.2 | 8.2.1 | Statistical Questions |
Section 8.3 | 8.3.1 | Writing Multiplication Equations |
8.3.2 | Distance, Rate, and Time | |
8.3.3 | Unit Conversion | |
Closure | 8.CL | Chapter Closure |
Opening | 9.OP | Chapter Opening |
---|---|---|
Section 9.1 | 9.1.1 | Volume of a Rectangular Prism |
9.1.2 | Nets and Surface Area | |
Section 9.2 | 9.2.1 | Multiplicative Growth and Percents |
9.2.2 | Composition and Decomposition of Percents | |
9.2.3 | Percent Discounts | |
9.2.4 | Simple Interest and Tips | |
Closure | 9.CL | Chapter Closure |
Section 9.3 | 9.3.1 | A Culminating Portions Challenge |
9.3.2 | Representing and Predicting Patterns | |
9.3.3 | Analyzing Data to Identify a Trend |
CP 1: Using Place Value to Round and Compare Decimals
CP 2: Addition and Subtraction of Decimals
CP 3: Addition and Subtraction of Fractions
CP 4: Addition and Subtraction of Mixed Numbers
CP 5: Multiple Representations of Portions
P 6: Locating Points on a Number Line and on a Coordinate Graph
CP 7A: Multiplication of Fractions and Decimals
CP 7B: Area and Perimeter of Quadrilaterals and Triangles
CP 8A: Rewriting and Evaluating Variable Expressions
CP 8B: Division of Fractions and Decimals
CP 9A: Displays of Data: Histograms and Box Plots
CP 9B: Solving One-Step Equations
Section 11.1
11.1.1 Plotting Polar Coordinates
11.1.2 Graphs of Polar Functions
11.1.3 Families of Polar Functions
11.1.4 Converting Between Polar and Rectangular Forms
Section 11.2
11.2.1 Using the Complex Plane
11.2.2 Operations with Complex Numbers Geometrically
11.2.3 Polar Form of Complex Numbers
11.2.4 Operations with Complex Numbers in Polar Form
11.2.5 Powers and Roots of Complex Numbers
Closure
Section 12.1
12.1.1 Arithmetic Series
12.1.2 Geometric Series
12.1.3 Infinite Geometric Series 12.1.4 Applications of Geometric Series
12.1.5 The Sum of the Harmonic Series
Section 12.2
12.2.1 The Binomial Theorem
12.2.2 Binomial Probabilities
Section 12.3
12.3.1 Expected Value of a Discrete Random Variable
12.3.2 Expected Value and Decision Making
Closure
Section 13.1
13.1.1 A Race to Infinity
13.1.2 Limits to Infinity
13.1.3 Evaluating Limits at a Point Algebraically
13.1.4 Another Look at e
Section 13.2
13.2.1 Trapping Area With Trapezoids
13.2.2 Area as a Function
13.2.2A Going all to Pieces: Writing an Area Program
13.2.3 Rocket Launch
Section 13.3
13.3.1 Velocity and Position Graphs
13.3.2 Instantaneous Velocity
13.3.3 Slope Functions
13.3.4 The Definition of Derivative
13.3.5 Slope and Area Under a Curve
Closure
2.3.4
Defining Concavity
4.4.1
Characteristics of Polynomial Functions
5.2.6
Semi-Log Plots
5 Closure
Closure How Can I Apply It? Activity 3
9.3.1
Transition States
9.3.2
Future and Past States
10.3.1
The Parametrization of Functions, Conics, and Their Inverses
10.3.2
Vector-Valued Functions
11.1.5
Rate of Change of Polar Functions
Section 6.1
6.1.1 Comparing Expressions
6.1.2 Comparing Quantities with Variables
6.1.3 One Variable Inequalities
6.1.4 Solving One Variable Inequalities
Section 6.2
6.2.1 Solving Equations
6.2.2 Checking Solutions and the Distributive Property
6.2.3 Solving Equations and Recording Work
6.2.4 Using a Table to Write Equations from Word Problems
6.2.5 Writing and Solving Equations
6.2.6 Cases with Infinite or No Solutions
6.2.7 Choosing a Solving Strategy
Chapter Closure
Section 7.1
7.1.1 Distance, Rate, and Time
7.1.2 Scaling Quantities
7.1.3 Solving Problems Involving Percents
7.1.4 Equations with Fraction and Decimal Coefficients
7.1.5 Creating Integer Coefficients
7.1.6 Creating Integer Coefficients Efficiently
7.1.7 Percent Increase and Decrease
7.1.8 Simple Interest
Section 7.2
7.2.1 Finding Missing Information in Proportional Relationships
7.2.2 Solving Proportions
Chapter Closure
Section 8.1
8.1.1 Measurement Precision
8.1.2 Comparing Distributions
Section 8.2
8.2.1 Representative Samples
8.2.2 Inference from Random Samples
Section 8.3
8.3.1 Introduction to Angles
8.3.2 Classifying Angles
8.3.3 Constructing Shapes
8.3.4 Building Triangles
Chapter Closure
Section 9.1
9.1.1 Circumference, Diameter, and Pi
9.1.2 Area of Circles
9.1.3 Area of Composite Shapes
Section 9.2
9.2.1 Surface Area and Volume
9.2.2 Cross Sections
9.2.3 Volume of a Prism
9.2.4 Volume of Non-Rectangular Prisms
Chapter Closure
Section 9.3
9.3.1 Volume and Scaling
9.3.2 Using Multiple Math Ideas to Create an Interior Design
9.3.3 Applying Ratios
Checkpoint 1: Area and Perimeter of Polygons
Checkpoint 2: Multiple Representations of Portions
Checkpoint 3: Multiplying Fractions and Decimals
Checkpoint 5: Order of Operations
Checkpoint 6: Writing and Evaluating Algebraic Expressions
Checkpoint 7A: Simplifying Expressions
Checkpoint 7B: Displays of Data: Histograms and Box Plots
Checkpoint 8: Solving Multi-Step Equations
Checkpoint 9: Unit Rates and Proportions
Section 11.1
11.1.1 Transforming Functions
11.1.2 Inverse Functions
Section 11.2
11.2.1 Investigating Data Representations
11.2.2 Comparing Data
11.2.3 Standard Deviation
Section 11.3
11.3.1 Using a Best-Fit Line to Make a Prediction
11.3.2 Relation Treasure Hunt
11.3.3 Investigating a Complex Function
11.3.4 Using Algebra to Find a Maximum
11.3.5 Exponential Functions and Linear Inequalities
Chapter Closure
Section A.1
A.1.1 Exploring Variables and Combining Like Terms
A.1.2 Simplifying Expressions by Combining Like Terms
A.1.3 Writing Algebraic Expressions
A.1.4 Using Zero to Simplify Algebraic Expressions
A.1.5 Using Algebra Tiles to Simplify Algebraic Expressions
A.1.6 Using Algebra Tiles to Compare Expressions
A.1.7 Simplifying and Recording Work
A.1.8 Using Algebra Tiles to Solve for x
A.1.9 More Solving Equations
Chapter Closure
Checkpoint 1: Solving Problems with Linear and Exponential Relationships
Checkpoint 2: Calculating Areas and Perimeters of Complex Shapes
Checkpoint 3: Angle Relationships in Geometric Figures
Checkpoint 4: Solving Proportions and Similar Figures
Checkpoint 5: Calculating Probabilities
Checkpoint 7: Factoring Quadratic Expressions
Checkpoint 8: Applying Trigonometric Ratios and the Pythagorean Theorem
Checkpoint 9: The Quadratic Web
Checkpoint 10: Solving Quadratic Equations
Checkpoint 11: Angle Measures and Areas of Regular Polygons
Checkpoint 12: Circles, Arcs, Sectors, Chords, and Tangents
Section 6.1
6.1.1 Rigid Transformations
6.1.2 Rigid Transformations on a Coordinate Graph
6.1.3 Describing Transformations
6.1.4 Using Rigid Transformations
Section 6.2
6.2.1 Multiplication and Dilation
6.2.2 Dilations and Similar Figures
6.2.3 Identifying Similar Shapes
6.2.4 Similar Figures and Transformations
6.2.5 Working With Corresponding Sides
6.2.6 Solving Problems Involving Similar Shapes
Chapter Closure
Section 7.1
7.1.1 Circle Graphs
7.1.2 Organizing Data in a Scatterplot
7.1.3 Identifying and Describing Association
Section 7.2
7.2.1 y = mx + b Revisited
7.2.2 Slope
7.2.3 Slope in Different Representations
7.2.4 More About Slope
7.2.5 Proportional Equations
Section 7.3
7.3.1 Using Equations to Make Predictions
7.3.2 Describing Association Fully
7.3.3 Association Between Categorical Variables
Chapter Closure
Section 8.1
8.1.1 Patterns of Growth in Tables and Graphs
8.1.2 Compound Interest
8.1.3 Linear and Exponential Growth
Section 8.2
8.2.1 Exponents and Scientific Notation
8.2.2 Exponent Rules
8.2.3 Negative Exponents
8.2.4 Operations with Scientific Notation
Section 8.3
8.3.1 Functions in Graphs and Tables
Chapter Closure
Section 9.1
9.1.1 Parallel Line Angle Pair Relationships
9.1.2 Finding Unknown Angles in Triangles
9.1.3 Exterior Angles in Triangles
9.1.4 AA Triangle Similarity
Section 9.2
9.2.1 Side Lengths and Triangles
9.2.2 Pythagorean Theorem
9.2.3 Understanding Square Root
9.2.4 Real Numbers
9.2.5 Applications of the Pythagorean Theorem
9.2.6 Pythagorean Theorem in Three Dimensions
9.2.7 Pythagorean Theorem Proofs
Chapter Closure
Section 10.1
10.1.1 Cube Roots
10.1.2 Surface Area and Volume of a Cylinder
10.1.3 Volumes of Cones and Pyramids
10.1.4 Volume of a Sphere
10.1.5 Applications of Volume
Chapter Closure
10.2.1 Indirect Measurement
10.2.2 Finding Unknowns
10.2.3 Analyzing Data to Identify a Trend
1. Operations with Signed Fractions and Decimals
2. Evaluating Expressions and Using Order of Operations
3. Unit Rates and Proportions
4. Area and Perimeter of Circles and Composite Figures
5. Solving Equations
6. Multiple Representations of Linear Equations
7. Solving Equations with Fractions and Decimals (Fraction Busters)
8. Transformations
9. Scatterplots and Association
Section 11.1
11.1.1 Simulations of Probability
11.1.2 More Simulations of Probability
11.1.3 Simulating Sampling Variability
Section 11.2
11.2.1 Statistical Test Using Sampling Variability
11.2.2 Variability in Experimental Results
11.2.3 Quality Control
11.2.4 Statistical Process Control
Section 11.3
11.3.1 Analyzing Decisions and Strategies
Chapter Closure
Section 12.1
12.1.1 Analyzing Trigonometric Equations
12.1.2 Solutions to Trigonometric Equations
12.1.3 Inverses of Trigonometric Functions
12.1.4 Reciprocal Trigonometric Functions
Section 12.2
12.2.1 Trigonometric Identities
12.2.2 Proving Trigonometric Identities
12.2.3 Angle Sum and Difference Identities
Chapter Closure
Section 1.1
1.1.1 Solving Puzzles in Teams
1.1.2 Investigating the Growth of Patterns
1.1.3 Multiple Representations of Functions
Section 1.2
1.2.1 Function Machines
1.2.2 Functions
1.2.3 Domain and Range
Section 1.3
1.3.1 Rewriting Expressions with Exponents
1.3.2 Zero and Negative Exponents
Chapter Closure
Section 2.1
2.1.1 Seeing Growth in Linear Functions
2.1.2 Comparing Δy and Δx
2.1.3 Slope
2.1.4 y= mx+ band More on Slope
Section 2.2
2.2.1 Modeling Linear Functions
2.2.2 Rate of Change
2.2.3 Equations of Lines in a Situation
2.2.4 Dimensional Analysis
Section 2.3
2.3.1 WritingtheEquation of a Line Given theSlope and a Point
2.3.2 Writingthe Equation of a Line Through Two Points
2.3.3 Writing y= mx+ b from Graphs and Tables
Chapter Closure
Section 3.1
3.1.1 Spatial Visualization and Reflections
3.1.2 Rotations and Translations
3.1.3 Slopes of Parallel and Perpendicular Lines
3.1.4 Defining Rigid Transformations
3.1.5 Using Transformations to Create Polygons
3.1.6 Symmetry
Section 3.2
3.2.1 Modeling Area and Perimeter with Algebra Tiles
3.2.2 Exploring an Area Model
3.2.3 Multiplying Polynomials and the Distributive Property
Section 3.3
3.3.1 Multiple Methods for Solving Equations
3.3.2 Fraction Busters
3.3.3 Solving Exponential and Complex Equations
Chapter Closure
Section 4.1
4.1.1 Line of Best Fit
4.1.2 Residuals
4.1.3 Upper and Lower Bounds
4.1.4 Least Squares Regression Line
Section 4.2
4.2.1 Residual Plots
4.2.2 Correlation
4.2.3 Association is Not Causation
4.2.4 Interpreting Correlation in Context
Chapter Closure
Section 5.1
5.1.1 Representing Exponential Growth
5.1.2 Rebound Ratios
5.1.3 The Bouncing Ball and Exponential Decay
Section 5.2
5.2.1 Generating and Investigating Sequences
5.2.2 Generalizing Arithmetic Sequences
5.2.3 Recursive Sequences
Section 5.3
5.3.1 ComparingGrowth in Tables and Graphs
5.3.2 Using Multipliers to Solve Problems
5.3.3 Comparing Sequences to Functions
Chapter Closure
Section 6.1
6.1.1 Working with Multi-Variable Equations
6.1.2 Summary of SolvingEquations
6.1.3 Solving Word Problems by Using Different Representations
6.1.4 Solving WordProblems by Writing Equations
Section 6.2
6.2.1 Solving Systems of Equations Using the Equal ValuesMethod
6.2.2 Solving Systems of Equations Using Substitution
6.2.3 Making Connections: Systems andMultiple Representation
Section 6.3
6.3.1 Solving Systems Using Elimination
6.3.2 More Elimination
6.3.3 Making Connections: Systems, Solutions, and Graphs
Section 6.4
6.4.1 Choosing a Strategy for Solving a System
6.4.2 Pulling it all Together
Chapter Closure
Section 7.1
7.1.1 Defining Congruence
7.1.2 Conditions for Triangle Congruence
7.1.3 Creating a Flowchart
7.1.4 Justifying Triangle CongruenceUsing Flowcharts
7.1.5 More Conditions for Triangle Congruence
7.1.6 Congruence of Triangles Through Rigid Transformations3947.1.7More Congruence Flowcharts
Section 7.2
7.2.1 Studying Quadrilaterals on a Coordinate Grid
7.2.2 Coordinate Geometry and Midpoints4
7.2.3 Identifying Quadrilaterals on a Coordinate Grid
Chapter Closure
Section 8.1
8.1.1 Investigating
8.1.2 Multiple Representations of Exponential Functions
8.1.3 More Applications of Exponential Functions
8.1.4 Exponential Decay
8.1.5 Graph →Equation
8.1.6 Completing the Multiple Representations Web
Section 8.2
8.2.1 Curve Fitting
8.2.2 Curved Best-Fit Models
8.2.3 Solving a System of Exponential Functions Graphically
Chapter Closure
Section 9.1
9.1.1 Solving Linear, One-Variable Inequalities
9.1.2 More Solving Inequalities
9.1.3 Solving Absolute Value Equations and Inequalities
Section 9.2
9.2.1 Graphing Two-Variable Inequalities
9.2.2 Graphing Linear and Nonlinear Inequalities
Section 9.3
9.3.1 Systems of Inequalities
9.3.2 More Systems of Inequalities
9.3.3 Applying Inequalities to Solve Problems
Chapter Closure
Section 10.1
10.1.1 Association in Two-Way Tables
10.1.2 Investigating Data Representations
10.1.3 Comparing Data
10.1.4 Standard Deviation
Section 10.2
10.2.1 Transforming Functions
10.2.2 Arithmetic Operations with Functions
10.2.3 Proving Linear and Exponential GrowthPatterns
Chapter Closure
Section 11.1 11.1.1 Introduction to Constructions
11.1.2 Constructing Bisectors
11.1.3 More Explorations with Constructions
Section 11.2
11.2.1 Solving Work and Mixing Problems
11.2.2 Solving Equations and Systems Graphically
11.2.3 Using a Best-Fit Line to Make a Prediction
11.2.4 Treasure Hunt
11.2.5 Using Coordinate Geometry and Constructions to Explore Shapes
11.2.6 Modeling with Exponential Functions and Linear Inequalities
Chapter Closure
Section A.1
A.1.1 Exploring Variables and Expressions
A.1.2 Using Zero to Simplify Algebraic Expressions
A.1.3 Using Algebra Tiles to Compare Expressions
A.1.4 Justifying and Recording Work
A.1.5 Using Algebra Tiles to Solve for x
A.1.6 More Solving Equations
A.1.7 Checking Solutions
A.1.8 Determining the Number of Solutions
A.1.9 UsingEquations to Solve Problems
Appendix Closure
Checkpoint1: Solving Linear Equations, Part 1 (Integer Coefficients)
Checkpoint 2: Evaluating Expressions and the Order of Operations
Checkpoint 3: Operations with Rational Numbers
Checkpoint 4: Laws of Exponents and Scientific Notation
Checkpoint 5: Writing the Equation of a Line
Checkpoint 6A: Solving Linear Equations, Part 2 (Fractional Coefficients)
Checkpoint 6B: Multiplying Binomials and Solving Equations with Parentheses
Checkpoint 7: Interpreting Associations
Checkpoint 8A: Rewriting Equations with More Than One Variable
Checkpoint 8B: Solving Problems by Writing Equations
Checkpoint 9: Solving Linear Systems of Equations
Checkpoint 10: Determining Congruent Triangles
Checkpoint 11: The Exponential Web
Section 1.1
1.1.1 Attributes of Polygons
1.1.2 More Attributes of Polygons
Section 1.2
1.2.1 Making Predictions and Investigating Results
1.2.2 Perimeters and Areas of Enlarging Patterns
11.2.3 Area as a Product and a Sum
1.2.4 Describing a Graph
Section 1.3
1.3.1 Angle Pair Relationships
1.3.2 Angles Formed by Transversals
1.3.3 More Angles Formed by Transversals
1.3.4 Angles and Sides of a Triangle
Chapter Closure
Section 2.1
2.1.1 Triangle Congruence Theorems
2.1.2 Flowcharts for Congruence
2.1.3 Converses
2.1.4 Proof by Contradiction
Section 2.2
2.2.1 Dilations
2.2.2 Similarity
Section 2.3
2.3.1 Conditions for Triangle Similarity
2.3.2 Determining Similar Triangles
2.3.3 Applying Similarity
2.3.4 Similar Triangle Proofs
Chapter Closure
Section 3.1
3.1.1 Using an Area Model
3.1.2 Using a Tree Diagram
3.1.3 Probability Models
3.1.4 Unions, Intersections, and Complements
3.1.5 Expected Value
Section 3.2
3.2.1 Constant Ratios in Right Triangles
3.2.2 Connecting Slope Ratios to Specific Angles
3.2.3 Expanding the Trig Table
3.2.4 The Tangent Ratio
3.2.5 Applying the Tangent Ratio
Chapter Closure
Section 4.1
4.1.1 Introduction to Factoring Expressions
4.1.2 Factoring with Area Models
4.1.3 Factoring More Quadratics
4.1.4 Factoring Completely
4.1.5 Factoring Special Cases
Section 4.2
4.2.1 Sine and Cosine Ratios
4.2.2 Selecting a Trig Tool
4.2.3 Inverse Trigonometry
4.2.4 Trigonometric Applications
Chapter Closure
Section 5.1
5.1.1 Investigating the Graphs of Quadratic Functions
5.1.2 Multiple Representations of Quadratic Functions
5.1.3 Zero Product Property
5.1.4 Writing Equations for Quadratic Functions
5.1.5 Completing the Quadratic Web
Section 5.2
5.2.1 Perfect Square Equations
5.2.2 Completing the Square
5.2.3 More Completing the Square
5.2.4 Introduction to the Quadratic Formula
5.2.5 Solving and Applying Quadratic Equations
5.2.6 Introducing Complex Numbers
Chapter Closure
Section 6.1
6.1.1 Special Right Triangles
6.1.2 Pythagorean Triples
6.1.3 Special Right Triangles and Trigonometry
6.1.4 Radicals and Fractional Exponents
Section 6.2
6.2.1 At Your Service
6.2.2 Angles on a Pool Table
6.2.3 Shortest Distance Problems
6.2.4 The Number System and Deriving the Quadratic Formula
6.2.5 Using Algebra to Find a Maximum
6.2.6 Analyzing a Game
Chapter Closure
Section 7.1
7.1.1 Explore-Conjecture-Prove
7.1.2 Properties of Rhombi
7.1.3 Two Column Proofs
7.1.4 More Geometric Proofs
7.1.5 Using SimilarTriangles to Prove Theorems
Section 7.2
7.2.1 Conditional Probability and Independence
7.2.2 More Conditional Probability
7.2.3 Applications of Probability
Chapter Closure
Section 8.1
8.1.1 Constructing Triangle Centers
Section 8.2
8.2.1 Angles of Polygons
8.2.2 Areas of Regular Polygons
Section 8.3
8.3.1 Area Ratios of Similar Figures
8.3.2 Ratios of Similarity
Section 8.4
8.4.1 A Special Ratio
8.4.2 Arcs and Sectors
8.4.3 Circles in Context
Chapter Closure
Section 9.1
9.1.1 Modeling Nonlinear Data
9.1.2 Parabola Investigation
9.1.3 Graphing Form of a Quadratic Function
9.1.4 Transforming the Absolute Value Function
Section 9.2
9.2.1 Quadratic Applications with Inequalities
9.2.2 Solving Systems of Equations
Section 9.3
9.3.1 Average Rate of Change and Projectile Motion5099.3.2Comparing the Growth of Functions
9.3.3 Piecewise-Defined Functions
9.3.4 Combining Functions
Section 9.4
9.4.1 Inverse Functions
Chapter Closure
Section 10.1
10.1.1 The Equation of a Circle
10.1.2 Completing the Square for Equations of Circles
10.1.3 The Geometric Definition of a Parabola
Section 10.2
10.2.1 Introduction to Chords
10.2.2 Angles and Arcs
10.2.3 Chords and Angles
10.2.4 Tangents
10.2.5 Tangents and Arcs
Chapter Closure
Section 11.1
11.1.1 Prisms and Cylinders
11.1.2 Volumes of Similar Solids
11.1.3 Ratios of Similarity
Section 11.2
11.2.1 Volume of a Pyramid
11.2.2 Surface Area and Volume of a Cone
11.2.3 Surface Area and Volume of a Sphere
Chapter Closure
Section 12.1
12.1.1 The Fundamental Counting Principle
12.1.2 Permutations
12.1.3 Combinations
12.1.4 Categorizing Counting Problems
Section 12.2
12.2.1 Using Geometry to CalculateProbabilities
12.2.2 Choosing a Model
12.2.3 The Golden Ratio
12.2.4 Some Challenging Probability Problems
Chapter Closure
Checkpoint 1: Solving Problems with Linear and Exponential Relationships
Checkpoint 2: Calculating Areas and Perimeters of Complex Shapes
Checkpoint 3: Angle Relationships in Geometric Figures
Checkpoint 4: Solving Proportions and Similar Figures
Checkpoint 5: Calculating Probabilities
Checkpoint 7: Factoring Quadratic Expressions
Checkpoint 8: Applying Trigonometric Ratios and the Pythagorean Theorem
Checkpoint 9: The Quadratic Web
Checkpoint 10: Solving Quadratic Equations
Checkpoint 11: Angle Measures and Areas of Regular Polygons
Checkpoint 12: Circles, Arcs, Sectors, Chords, and Tangents
Section 1.1
1.1.1 Solving a Function Puzzle in Teams
1.1.2 Using a Graphing Calculator to Explore a Function
1.1.3 Function Investigation
1.1.4 Combining Linear Functions
Section 1.2
1.2.1Representing Points of Intersection
1.2.2 Modeling a Geometric Relationship
1.2.3 Describing Data
Chapter Closure
Section 2.1
2.1.1 Transforming Quadratic Functions
2.1.2 Modeling with Parabolas
Section 2.2
2.2.1 Transforming Other Parent Graphs
2.2.2 Describing (h,k) for Each Family of Functions
2.2.3 Transformations of Functions 2.2.4 TransformingNon-Functions
2.2.5 Developing a Mathematical Model
Section 2.3
2.3.1 Completing the Square
Chapter Closure
Section 3.1
3.1.1 Strategies for Solving Equations
3.1.2 Solving Equations Graphically
3.1.3 Multiple Solutions to Systems of Equations
3.1.4 Using Systems of Equations to Solve Problems
Section 3.2
3.2.1 Solving Inequalities with One or Two Variables
3.2.2 Using Systems to Solve a Problem
3.2.3 Applications of Systems of Inequalities
3.2.4 Using Graphs to DetermineSolutions
Chapter Closure
Section 4.1
4.1.1 Survey Design
4.1.2Samples and the Role of Randomness
4.1.3 Bias in Convenience Samples
Section 4.2
4.2.1 Testing Cause and Effect with Experiments
4.2.2 Conclusions from Studies
Section 4.3
4.3.1Relative Frequency Histograms
4.3.2 The Normal Probability Density Function
4.3.3 Percentiles
Section 4.4
4.4.1 Cross-Sections and Solids of a Revolution
4.4.2 Modeling with Geometric Solids
4.4.3 Designing to Meet Constraints
Chapter Closure
Section 5.1
5.1.1 “Undo” Equations
5.1.2 Using a Graph to Find an Inverse
5.1.3 More Inverse Functions
Section 5.2
5.2.1 TheInverse of an Exponential Function
5.2.2 Defining the Inverse of an Exponential Function
5.2.3 Investigating the Family of Logarithmic Functions
5.2.4 Transformations of Logarithmic Functions
Chapter Closure
Section 6.1
6.1.1 Simulations of Probability
6.1.2 More Simulations of Probability
6.1.3 Simulating Sampling Variability
Section 6.2
6.2.1 Statistical Test Using Sampling Variability
6.2.2 Variability in Experimental Results
6.2.3 Quality Control
6.2.4 Statistical Process Control
Section 6.3
6.3.1 Analyzing Decisions and Strategies
Chapter Closure
Section 7.1
7.1.1 Using Logarithms to Solve Exponential Equations
7.1.2 Investigating the Properties of Logarithms
7.1.3 Writing Equations of Exponential Functions
7.1.4 An Application of Logarithms
Section 7.2
7.2.1 Determining Missing Parts of Triangles
7.2.2 Law of Sines
7.2.3 Law of Cosines
7.2.4 The Ambiguous Case
7.2.5 Choosing a Tool
Chapter Closure
Section 8.1
8.1.1 Sketching Graphs of Polynomial Functions
8.1.2 More Graphs of Polynomial Functions
8.1.3 Stretch Factors for Polynomial Functions
Section 8.2
8.2.1 Writing Equations Using Complex Roots
8.2.2 More Real and Complex Roots
Section 8.3
8.3.1 Polynomial Division
8.3.2 Factors and Rational Zeros
8.3.3 An Application of Polynomials
8.3.4 Special Cases of Factoring
Chapter Closure
Section 9.1
9.1.1 Introductions to Periodic Models
9.1.2 Graphing the Sine Functions
9.1.3 Unit Circle ↔Graph
9.1.4 Graphing and Interpreting the Cosine Function
9.1.5 Defining a Radian
9.1.6 Building a Unit Circle
9.1.7 The Tangent Function
Section 9.2 9.2.1 Transformations of y= sin(x)
9.2.2 One More Parameter for a Periodic Function
9.2.3 Period of a Trigonometric Function
9.2.4 Graph ↔Equation
Chapter Closure
Section 10.1
10.1.1 Introduction to Arithmetic Series
10.1.2 More Arithmetic Series
10.1.3 General Arithmetic Series
10.1.4 Summation Notation and Combinations of Series
10.1.5 Mathematical Induction
Section 10.2
]10.2.1 Geometric Series
10.2.2 Infinite Series
Section 10.3
10.3.1 Using a Binomial Probability Model
10.3.2 Pascal’s Triangle and the Binomial Theorem
10.3.3 The Number e
Chapter Closure
Section 11.1
11.1.1 Simplifying Rational Expressions
11.1.2 Multiplying and Dividing Rational Expressions
11.1.3 Adding and Subtracting Rational Expressions
11.1.4 Operations with Rational Expressions
Section 11.2
11.2.1 Creating a Three-Dimensional Model
11.2.2 Graphing Equations in Three Dimensions
11.2.3 Solving Systems of Three Equations with Three Variables
11.2.4 Using Systems of Three Equations for Curve Fitting
Chapter Closure
Section 12.1
12.1.1 Analyzing Trigonometric Equations
12.1.2 Solutions to TrigonometricEquations
12.1.3 Inverses of Trigonometric Functions
12.1.4 Reciprocal Trigonometric Functions
Section 12.2
12.2.1 Trigonometric Identities
12.2.2 Proving Trigonometric Identities
12.2.3 Angle Sum and Difference Identities
Chapter Closure
Checkpoint 2: Solving Quadratic Equations
Checkpoint 3: Function Notation and Describing a Function
Checkpoint 4: Expressions with Integer and Rational Exponents
Checkpoint 5: Transformations of Functions
Checkpoint 6: Solving Complicated Equations and Systems
Checkpoint 7: Solving and Graphing Inequalities
Checkpoint 8: Determining the Equation for the Inverse of a Function
Checkpoint 9A: Solving Equations with Exponents
Checkpoint 9B: Rewriting Expressions and Solving Equations with Logarithms
Checkpoint 10: Solving Triangles
Checkpoint 11: Roots and Graphs of Polynomial Functions
Checkpoint 12: Periodic Functions
Sección 1.1
1.1.1 Resolución de acertijos en equipo
1.1.2 Investigar el crecimiento de patrones
1.1.3 Investigación de los gráficos de funciones cuadráticas
Sección 1.2
1.2.1 Descripción de un gráfico
1.2.2 Raíz cúbica y funciones de valor absoluto
1.2.3 Máquinas de funciones
1.2.4 Funciones
1.2.5 Dominio y rango
Resumen del Capítulo
Sección 2.1
2.1.1 Observación del crecimiento en las representaciones lineales
2.1.2 Pendiente
2.1.3 Comparación de Δy y Δx
2.1.4 y = mx + b y más información sobre pendientes
Sección 2.2
2.2.1 Pendiente como movimiento
2.2.2 Tasa de cambio
2.2.3 Ecuaciones de rectas en situaciones dadas
Sección 2.3
2.3.1 Hallar una ecuación a partir de la pendiente y un punto
2.3.2 Cómo hallar la ecuación de una recta que atraviesa dos puntos
Actividad de extensión Cómo hallar y = mx + b a partir de gráficos y tablas
Resumen del Capítulo
Sección 3.1
3.1.1 Simplificación de expresiones exponenciales
3.1.2 Exponentes negativos eiguales a cero
Sección 3.2
3.2.1 Ecuaciones ↔ azulejos algebraicos
3.2.2 Exploración de modelos de área
3.2.3 Multiplicación de binomios y la Propiedad distributiva
3.2.4 Uso de rectángulos genéricos para multiplicar
Sección 3.3
3.3.1 Resolver ecuaciones conmultiplicaciones y valores absolutos
3.3.2 Trabajando con ecuaciones con múltiples variables
3.3.3 Resumen de la resolución de ecuaciones
Resumen del Capítulo
Sección 4.1
4.1.1 Resolución de
problemas de palabras con
4.1.2 ¿Una ecuación o dos
Sección 4.2
4.2.1 Resolución de sistemas de ecuaciones por sustitución
4.2.2 Realizar conexiones: sistemas, soluciones, y gráficos
4.2.3 Resolución de sistemas por medio de la eliminación
4.2.4 Más información sobre el método de eliminación
4.2.5 Selección de una estrategia para la resolución de sistemas
Sección 4.3
4.3.1 Unificar todoResumen del Capítulo
Opening | 5.OP | Chapter Opening |
---|---|---|
Section 5.1 | 5.1.1 | Representing Fraction Multiplication |
5.1.2 | Describing Parts of Parts | |
5.1.3 | Calculating Parts of Parts | |
5.1.4 | Multiplying Mixed Numbers | |
Section 5.2 | 5.2.1 | Making Sense of Decimal Multiplication |
5.2.2 | Fraction Multiplication Number Sense | |
Section 5.3 | 5.3.1 | Rearranging Areas |
5.3.2 | Area of a Parallelogram | |
5.3.3 | Area of a Triangle | |
5.3.4 | Area of a Trapezoid | |
Closure | 5.CL | Chapter Closure |
Section 5.4 | Mid-Course Reflection Activities |
Sección 6.1
6.1.1 Recta de mejor ajuste
6.1.2 Valores residuales
6.1.3 Cota superior y cota inferior
6.1.4 Línea de regresión de mínimos cuadrados
Sección 6.2
6.2.1 Diagramas de valor residual
6.2.2 Correlación
6.2.3 Asociación no es causalidad
6.2.4 Interpretación de la correlación en contexto
6.2.5 Modelos de mejor ajuste curvos
Resumen del Capítulo
Sección 7.1
7.1.1 Investigar y = b x
7.1.2 Múltiples representaciones de funciones exponenciales
7.1.3 Más aplicaciones del crecimiento exponencial
7.1.4 Decaimiento exponencial
7.1.5 Gráfico → ecuación
7.1.6 Completar la red de representaciones múltiples
Sección 7.2
7.2.1 Curvas de ajuste y exponentes fraccionarios
7.2.2 Más curvas de ajuste
7.2.3 Resolución gráfica de un sistema de funciones exponenciales
Resumen del Capítulo
Sección 8.1
8.1.1 Introducción a la factorización de expresiones cuadráticas
8.1.2 Factorización con rectángulos genéricos
8.1.3 Factorización en casos especiales
8.1.4 Factorizar completamente
8.1.5 Atajos de factorización
Sección 8.2
8.2.1 Múltiples representaciones de funciones cuadráticas
8.2.2 Propiedad de producto cero
8.2.3 Más formas de hallar puntos de corte con el eje x
8.2.4 Completar la red cuadrática
8.2.5 Completar cuadrados
Resumen del Capítulo
Sección 9.1
9.1.1 Resolución de ecuaciones cuadráticas
9.1.2 Introducción a la Fórmula cuadrática
9.1.3 Más ecuaciones cuadráticas
9.1.4 Elección de una estrategia
Sección 9.2
9.2.1 Resolución de desigualdades lineales de una variable
9.2.2 Más desigualdades
Sección 9.3
9.3.1 Graficación de desigualdades lineales con dos variables
9.3.2 Graficación de desigualdades lineales y no lineales
Sección 9.4
9.4.1 Sistemas de desigualdades
9.4.2 Más sistemas de desigualdades
9.4.3 Aplicación de desigualdades a la resolución de problemas
Resumen del Capítulo
Sección 10.1
10.1.1 Asociaciones en tablas de doble entrada
Sección 10.2
10.2.1 Resolver reescribiend
10.2.2 Rompe fracciones
10.2.3 Múltiples métodos de resolución de ecuaciones
10.2.4 Determinar la cantidad de soluciones
10.2.5 Derivación de la Fórmula cuadrática y el sistema numérico
10.2.6 Más información sobre resolución y aplicaciones
Sección 10.3
10.3.1 Intersección de dos funciones
10.3.2 Cantidad de intersecciones de una parábola
10.3.3 Resolución de ecuaciones cuadráticas y con valores absolutos
Resumen del Capítulo
Sección 11.1
11.1.1 Transformación de funciones
11.1.2 Funciones inversas
Sección 11.2
11.2.1 Investigación de representaciones de datos
11.2.2 Comparación de datos
11.2.3 Desviación estándar
Sección 11.3
11.3.1 Uso de una recta de mejor ajuste para realizar predicciones
11.3.2 Búsqueda del tesoro de relaciones
11.3.3 Investigación de una función compleja
11.3.4 Uso del álgebra para hallar un máximo
11.3.5 Funciones exponenciales y desigualdades lineales
Resumen del Capítulo6
Sección A.1
A.1.1 Exploración de variables y agrupación de términos semejantes
A.1.2 Simplificación de expresiones combinando términos semejantes
A.1.3 Escritura de expresiones algebraicas
A.1.4 Uso del cero para simplificar expresiones algebraicas
A.1.5 Uso de azulejos algebraicos para simplificar expresiones algebraicas
A.1.6 Uso de azulejos algebraicos para comparar expresiones
A.1.7 Simplificación y registro del trabajo
A.1.8 Uso de azulejos algebraicos para resolver para
x
A.1.9 Más ecuaciones para resolver
Resumen del Apéndic
Sección1.1
1.1.1 Creación de una manta usando la simetría
1.1.2 Cómo hacer predicciones e investigar los resultados
1.1.3 Perímetro yárea de patrones de azulejos que se agrandan
1.1.4 Argumentos lógicos
1.1.5 Construcción de un caleidoscopio
Sección 1.2
1.2.1 Visualización espacial y reflexiones
1.2.2 Transformaciones rígidas: Rotaciones y traslaciones
1.2.3 Pendientes de rectas paralelas y perpendiculares
1.2.4 Definición de transformaciones
1.2.5 Uso de las transformaciones para crear formas
1.2.6 Simetría
Sección1.3
1.3.1 Atributos y características de las formas
1.3.2 Más características de las figuras
Resumen del Capítulo
Sección 2.1
2.1.1 Ángulos complementarios, suplementarios y opuestos por el vértice
2.1.2 Ángulos formados por transversales
2.1.3 Más ángulos formados por transversales
2.1.4 Ángulos de un triángulo
2.1.5 Aplicación de las relaciones entre ángulos1
Sección 2.2
2.2.1 Unidades de medida
2.2.2 Áreas de triángulos y figuras compuestas
2.2.3 Áreas de paralelogramos y trapecios
2.2.4 Alturas y áreas
Sección 2.3
2.3.1 Teorema de la desigualdad de un triángulo
2.3.2 El Teorema de Pitágoras
Resumen del Capítulo
Sección 3.1
3.1.1 Dilatación
3.1.2 Semejanzas
3.1.3 Uso de las razones de semejanza
3.1.4 Aplicaciones y notación
Sección3.2
3.2.1 Condiciones de semejanza de triángulos
3.2.2 Creación de un diagrama de flujo
3.2.3 Semejanza entre triángulos y congruencia
3.2.4 Más condiciones de semejanza de triángulos
3.2.5 Determinar semejanzas
3.2.6 Aplicación de la semejanza
Resumen del Capítulo
Sección4.1
4.1.1 Razones constantes en triángulos rectángulos
4.1.2 Relación entre razones de la pendiente y ángulos específicos
4.1.3 Ampliación de la tabla de trigonometría
4.1.4 La razón tangente
4.1.5 Aplicación de la razón tangente
Sección 4.2
4.2.1 Uso de un modelo de área
4.2.2 Uso de un diagrama de árbol
4.2.3 Modelos de probabilidad
4.2.4 Uniones, intersecciones y complementos
4.2.5Valor esperado
Resumen del Capítulo
Sección5.1
5.1.1 Razones seno y coseno
5.1.2 Elección de una herramienta de trigonometría
5.1.3 Trigonometría inversa
5.1.4 Aplicaciones trigonométricas
Sección5.2
5.2.1 Triángulos rectángulos especiales
5.2.2 Ternas pitagóricas
Sección 5.3
5.3.1 Cómo hallar las partes faltantes de los triángulos
5.3.2 Ley de los senos
5.3.3 Ley de los cosenos
5.3.4 Triángulos ambiguos(Optativo)
5.3.5 Elección de una herramienta
Resumen del Capítulo
Sección6.1
6.1.1Triángulos congruentes
6.1.2 Condiciones para congruencia de triángulos
6.1.3 Congruencia de triángulos a través de transformaciones rígidas3526.1.4Diagramas de flujo para congruencia
6.1.5 Recíprocos
Sección6.2
6.2.1 Ángulos sobre una mesa de pool
6.2.2 Investigar un triángulo
6.2.3 Creación de un modelomatemático
6.2.4 Análisis de un juego
6.2.5 Uso de transformaciones y simetría para diseñar copos de nieve
Resumen del Capítulo
Sección 7.1
7.1.1 Propiedades de un círculo
7.1.2 Construcción de un tetraedro
7.1.3 Problemas de distancia más corta
7.1.4 Uso de la simetría para el estudio de polígonos
Sección 7.2
7.2.1 Cuadriláteros especiales y demostraciones
7.2.2 Propiedades de los rombos
7.2.3 Más demostraciones con triángulos congruentes4297.2.4Más propiedades de los cuadriláteros
7.2.5 Demostraciones en dos columnas4387.2.6Explora-Conjetura-Demuestra
Sección 7.3
7.3.1 Estudio de cuadriláteros sobre una cuadrilla de coordenadas
7.3.2 Geometría en coordenadas y puntos medios
7.3.3 Cómo identificar cuadriláteros sobre una cuadrícula de coordenadas
Resumen del Capítulo
Sección 8.1
8.1.1 Molinillos y polígonos
8.1.2 Ángulos interiores de los polígonos
8.1.3 Ángulos de polígonos regulares
8.1.4 Conexiones de los ángulos de los polígonos regulares
8.1.5 Cómo calcular las áreas de polígonos regulares
Sección 8.2
8.2.1 Razones de área de figuras semejantes
8.2.2 Razones de semejanza
Sección 8.3
8.3.1 Una razón especial
8.3.2 Área y circunferencia de un círculo
8.3.3 Círculos en contexto
Resumen del Capítulo
Sección 9.1
9.1.1Sólidos tridimensionales
9.1.2 Volúmenes y áreasde superficies de los prismas
9.1.3 Prismas y cilindros
9.1.4 Volúmenes de sólidos similares
9.1.5 Razones de semejanza
Sección 9.2
9.2.1 Introducción a las construcciones5529.2.2Construcción de bisectrices
9.2.3 Más exploraciones con construcciones
9.2.4 Otras construcciones
Resumen del Capítulo
Sección 10.1
10.1.1 Introducción a las cuerdas
10.1.2 Ángulos y arcos
10.1.3 Cuerdas y ángulos
10.1.4 Tangentes y secantes
10.1.5 Resolver problemas con círculos
Sección 10.2
10.2.1 Probabilidad condicional e independencia’
10.2.2 Tablas de doble entrada
10.2.3 Aplicaciones de probabilidad
Sección10.3
10.3.1 El Principio fundamental de conteo
10.3.2 Permutaciones
10.3.3 Combinaciones
10.3.4 Categorizar problemas de conteo
10.3.5 Algunos problemas de probabilidad desafiantes
Resumen del Capítulo
Sección11.1
11.1.1 Sólidos platónicos
11.1.2 Pirámides
11.1.3 Volumen de una pirámide
11.1.4 Área de superficie y volumen de un cono
11.1.5 Área de superficie y volumen de una esfera
Sección 11.2
11.2.1 Coordenadas en una esfera
11.2.2 Tangentes y arcos
11.2.3 Relaciones de secantes y tangentes
Resumen del Capítulo
Sección 12.1
12.1.1 La ecuación de un círculo
12.1.2 Técnica de completar cuadrados para las ecuaciones de círculos
12.1.3 Introducción a las secciones cónicas
12.1.4 Graficación de una parábola usando el foco y la directriz
Sección 12.2
12.2.1 Uso de la geometría en coordenadas y las construcciones para explorar las formas
12.2.2 La Fórmula de los poliedros de Euler
12.2.3 La razón áurea
12.2.4 Uso de la geometría para hallar probabilidades
Resumen del Capítulo
Sección 1.1
1.1.1 Resolución de acertijos en equipo
1.1.2 Cómo usar una calculadora gráfica para explorar una función
1.1.3 Dominioy rango
1.1.4 Puntos de intersección en representaciones múltiples
Sección 1.2
1.2.1 Modelado de una relación geométrica
1.2.2 Investigación de funciones
1.2.3 La familia de funciones lineales
1.2.4 Reto de investigación de funciones
Resumen del Capítulo
Sección 2.1
2.1.1 Modelado de datos no lineales
2.1.2 Investigación sobre parábolas
2.1.3 Graficar una parábola sin una tabla
2.1.4 Reescribir en la forma de graficación
2.1.5 Modelación matemática con parábolas
Sección 2.2
2.2.1 Transformación de otros gráficos madre
2.2.2 Descripción de (h, k) para cada familia de funciones
2.2.3 Transformaciones de funciones
2.2.4 Transformación de ecuaciones que no son funciones
2.2.5 Transformación de funciones seccionadas
Resumen del Capítulo
Sección 3.1
3.1.1 Expresiones equivalentes
3.1.2 Reescribir expresiones y determinar equivalencias
3.1.3 Resolver reescribiendo
Sección 3.2
3.2.1 Investigación de funciones racionales
3.2.2 Simplificación de expresiones racionales
3.2.3 Multiplicación y división de expresiones racionales
3.2.4 Suma y resta de expresiones racionales1503.2.5Creación de nuevas funciones
Resumen del Capítulo
Sección 4.1
4.1.1 Estrategias de resolución de ecuaciones
4.1.2 Resolución de ecuaciones y sistemas en forma gráfica
4.1.3 Hallar múltiples soluciones a sistemas de ecuaciones
4.1.4 Uso de sistemas de ecuaciones para resolver problemas
Sección 4.2
4.2.1 Resolución de desigualdades con una o dos variables
4.2.2 Uso de sistemas para resolver un problema
4.2.3 Aplicación de los sistemas de desigualdades lineales
4.2.4 Uso de gráficos para hallar soluciones
Resumen del Capítulo
Sección 5.1
5.1.1 “Deshacer” ecuaciones
5.1.2 Usar un gráfico para hallar una inversa
5.1.3 Hallar inversas y justificar algebraicamente
Sección 5.2
5.2.1 Hallar la inversa de una función exponencial
5.2.2 Definir la inversa de una función exponencial
5.2.3 Investigar la familia de funciones logarítmicas
5.2.4 Transformaciones de funciones logarítmicas
5.2.5 Investigar composiciones de funciones
Resumen del Capítulo
Sección 6.1
6.1.1 Creación de un modelo tridimensional
6.1.2 Graficación de ecuaciones en tres dimensiones
6.1.3 Sistemas de tres ecuaciones variables
6.1.4 Resolución de sistemas de tres ecuaciones con tres incógnitas
6.1.5 Empleo de sistemas de tres ecuaciones para curvas de ajuste
Sección 6.2
6.2.1 Uso de logaritmos para resolver ecuaciones exponenciales
6.2.2 Investigación de las propiedades de los logaritmos
6.2.3 Escritura de ecuaciones de funciones exponenciales
6.2.4 Una aplicación de los logaritmos
Resumen del Capítulo
Sección 7.1
7.1.1 Introducción a los modelos cíclicos
7.1.2 Cómo graficar la función seno
7.1.3 Círculo de unidad↔Gráfico
7.1.4 Cómo graficar e interpretar la función coseno
7.1.5 Definición de radián
7.1.6 Construcción de un círculo de unidad
7.1.7 La función tangente
Sección 7.2
7.2.1 Transformaciones de y= sen x
7.2.2 Un parámetro más para una función cíclica
7.2.3 Período de una función cíclica
7.2.4 Gráfico↔Ecuación
Resumen del Capítulo
Sección 8.1
8.1.1 Cómo graficar funciones polinómicas
8.1.2 Más gráficos de polinomios
8.1.3 Factores de estiramiento para funciones polinómicas
Sección 8.2
8.2.1 Introducción a los números imaginarios
8.2.2 Raíces complejas
8.2.3 Más números complejos y ecuaciones
Sección 8.3
8.3.1 División de polinomios
8.3.2 Factores y raíces enteras
8.3.3 Una aplicación de polinomios
Resumen del Capítulo
Sección 9.1
9.1.1 Diseño de encuestas
9.1.2 Muestras y el rol de la aleatorización
9.1.3 Sesgo en muestras por conveniencia
Sección 9.2
9.2.1 Probando la causa y el efecto con experimentos
9.2.2 Conclusiones a partir de estudios
Sección 9.3
9.3.1 Histogramas de frecuencia relativa
9.3.2 La función de densidad de probabilidad normal
9.3.3 Percentiles
Resumen del Capítulo
Sección 10.1
10.1.1 Introducción a las series aritméticas
10.1.2 Más series aritméticas
10.1.3 Series aritméticas generales
10.1.4 Notación de suma y combinaciones de series
Sección10.2
10.2.1 Series geométricas
10.2.2 Series infinitas
Sección10.3
10.3.1 El triángulo de Pascal y el Teorema del binomio
10.3.2 El númeroe
Resumen del Capítulo
Sección 11.1
11.1.1 Simulaciones de probabilidad
11.1.2 Más simulaciones de probabilidad
11.1.3 Simulación de la variabilidad muestral
Sección 11.2
11.2.1 Evaluación estadística usando la variabilidad muestral
11.2.2 Variabilidad en los resultados experimentales
11.2.3 Control de calidad
11.2.4 Control estadístico de procesos
Sección 11.3
11.3.1 Análisis de decisiones y estrategias
Resumen del Capítulo
Sección 12.1
12.1.1 Analizando ecuaciones trigonométricas
12.1.2 Soluciones de las ecuaciones trigonométricas
12.1.3 Inversas de las funciones trigonométricas
12.1.4 Funciones trigonométrica recíprocas
Sección 12.2 12.2.1 Identidades trigonométricas
12.2.2 Demostrando identidades trigonométricas
12.2.3 Identidades de suma y diferencia de ángulos
Resumen del Capítulo
Sección A.1
A.1.1 Representación del crecimiento exponencia
A.1.2 Razones de rebote
A.1.3 El balón que rebota y el decaimiento exponencial
Sección A.2
A.2.1 Generación e investigación de progresiones
A.2.2 Generalización de progresiones aritméticas
A.2.3 Progresiones recurrentes
SecciónA.3
A.3.1 Patrones de crecimiento en tablas y gráficos
A.3.2 Uso de multiplicadores para resolver problemas
‘A.3.3 Comparación de progresiones y funciones
Resumen del Apéndice
Sección B.1
B.1.1 Investigar y= bx
B.1.2 Múltiples representaciones de funciones exponenciales
B.1.3 Más aplicaciones del crecimiento exponencial
B.1.4 Decaimiento exponencial
B.1.5 Gráfico →ecuación
B.1.6 Completar la red de representaciones múltiples
Sección B.2
B.2.1 Curvas de ajuste y exponentes fraccionariosB31B.2.2Más curvas de ajuste
B.2.3 Resolución gráfica de un sistema de funciones exponenciales
Resumen del Apéndice
Sección C.1
C.1.1 Investigación de representaciones de datos
C.1.2 Comparación de datos
C.1.3 Desviación estándar
Section 1.1
1.1.1 Solving Puzzles in Teams
1.1.2
Investigating the Growth of Patterns
1.1.3 Investigating the Graphs of Quadratic Functions
Section 1.2
1.2.1 Describing a
Graph
1.2.2 Cube Root and Absolute Value Functions
1.2.3 Function Machines
1.2.4 Functions
1.2.5 Domain and Range
Chapter Closure
Section 2.1
2.1.1 Seeing Growth in Linear Representations
2.1.2 Slope
2.1.3 Comparing Δy and Δx
2.1.4 y = mx + b and More on Slope
Section 2.2
2.2.1 Slope as Motion
2.2.2 Rate of Change
2.2.3 Equations of Lines in Situations
Section 2.3
2.3.1 Finding an Equation Given a Slope and a Point
2.3.2 Finding the Equation of a Line Through Two Points
Extension Activity Finding y = mx + b from Graphs and Tables
Chapter Closure
Section 3.1
3.1.1 Simplifying Exponential Expressions
3.1.2 Zero and Negative Exponents
Section 3.2
3.2.1 EquationsAlgebra Tiles
3.2.2 Exploring an Area Model
3.2.3 Multiplying Binomials and the Distributive Property
3.2.4 Using Generic Rectangles to Multiply
Section 3.3
3.3.1 Solving Equations With Multiplication and Absolute Value
3.3.2 Working With Multi-Variable Equations
3.3.3 Summary of Solving Equations
Chapter Closure
Section 4.1
4.1.1 Solving Word Problems by Writing Equations
4.1.2 One Equation or Two?
Section 4.2
4.2.1 Solving Systems of Equations Using Substitution
4.2.2 Making Connections: Systems, Solutions, and Graphs
4.2.3 Solving Systems Using Elimination
4.2.4 More Elimination
4.2.5 Choosing a Strategy for Solving Systems
Section 4.3
4.3.1 Pulling it all Together
Chapter Closure
Section 6.1
6.1.1 Line of Best Fit
6.1.2 Residuals
6.1.3 Upper and Lower Bounds
6.1.4 Least Squares Regression Line
Section 6.2
6.2.1 Residual Plots
6.2.2 Correlation
6.2.3 Association is N
ot Causation
6.2.4 Interpreting Correlation in Context
6.2.5 Curved Best – Fit
Models
Chapter Closure
Opening | 6.OP | Chapter Opening |
---|---|---|
Section 6.1 | 6.1.1 | Dividing |
6.1.2 | Fractions as Division Problems | |
6.1.3 | Problem Solving with Division | |
6.1.4 | Solving Problems Involving Fraction Division | |
Section 6.2 | 6.2.1 | Order of Operations |
6.2.2 | Area of a Rectangular Shape | |
6.2.3 | Naming Perimeters of Algebra Tiles | |
6.2.4 | Combining Like Terms | |
6.2.5 | Evaluating Algebraic Expressions | |
Closure | 6.CL | Chapter Closure |
Section 7.1
7.1.1 Investigating y= bx^3
7.1.2 Multiple Representations of Exponential Functions
7.1.3 More Applications of Exponential Growth
7.1.4 Exponential Decay
7.1.5 Graph→Equation
7.1.6 Completing the Multiple Representations Web
Section 7.2
7.2.1 Curve Fitting and Fractional Exponents
7.2.2 More Curve Fitting
7.2.3 Solving a System of Exponential Functions Graphically
Chapter Closure
Section 8.1
8.1.1 Introduction to Factoring Quadratics
8.1.2 Factoring with Generic Rectangles
8.1.3 Factoring with Special Cases
8.1.4 Factoring Completely
8.1.5 Factoring Shortcuts
Section 8.2
8.2.1 Multiple Representations for Quadratic Functions
8.2.2 Zero Product Property
8.2.3 More Ways To Find the x-Intercepts
8.2.4 Completing the Quadratic Web
8.2.5 Completing the Square
Chapter Closure
Section 9.1
9.1.1 Solving Quadratic Equations
9.1.2 Introduction to the Quadratic Formula
9.1.3 More Solving Quadratic Equations
9.1.4 Choosing a Strategy
Section 9.2
9.2.1 Solving Linear, One-Variable Inequalities
9.2.2 More Solving Inequalities
Section 9.3
9.3.1 Graphing Two-Variable Inequalities
9.3.2 Graphing Linear and Non-Linear Inequalities
Section 9.4
9.4.1 Systems of Inequalities
9.4.2 More Systems of Inequalities
9.4.3 Applying Inequalities to Solve Problems
Chapter Closure
Section 10.1
10.1.1 Association in Two-Way Tables
Section 10.2
10.2.1 Solving by Rewriting
10.2.2 Fraction Busters
10.2.3 Multiple Methods for Solving Equations
10.2.4 Determining the Number of Solutions
10.2.5 Deriving the Quadratic Formula and the Number System
10.2.6 More Solving and an Application
Section 10.3
10.3.1 Intersection of Two Functions
10.3.2 Number of Parabola Intersections
10.3.3 Solving Quadratic and Absolute Value Inequalities
Chapter Closure
Section 11.1
11.1.1 Transforming Functions
11.1.2 Inverse Functions
Section 11.2
11.2.1 Investigating Data Representations
11.2.2 Comparing Data’
11.2.3 Standard Deviation
Section 11.3
11.3.1 Using a Best-Fit Line to Make a Prediction
11.3.2 Relation Treasure Hunt
11.3.3 Investigating a Complex Function
11.3.4 Using Algebra to Find a Maximum
11.3.5 Exponential Functions and Linear Inequalities
Chapter Closure
Section A.1
A.1.1 Exploring Variables and Combining Like Terms
A.1.2 Simplifying Expressions by Combining Like Terms
A.1.3 Writing Algebraic Expressions
A.1.4 Using Zero to Simplify Algebraic Expressions
A.1.5 Using Algebra Tiles to Simplify Algebraic Expressions
A.1.6 Using Algebra Tiles to Compare Expressions
A.1.7 Simplifying and Recording Work
A.1.8 Using Algebra Tiles to Solve for x
A.1.9 More Solving Equations
Chapter Closure
Section 1.1
1.1.1 Creating Quilt Using Symmetry
1.1.2 Making Predictions and Investigating Results
1.1.3 Perimeters and Areas of Enlarging Tile Patterns
1.1.4 Logical Arguments
1.1.5 Building a Kaleidoscope
Section 1.2
1.2.1 Spatial Visualization and Reflection
1.2.2 Rigid Transformations: Rotation and Translations
1.2.3 Slope of Parallel and Perpendicular Lines
1.2.4 Defining Transformations
1.2.5 Using Transformations to Create Shapes
1.2.6 Symmetry
Section 1.3
1.3.1 Attributes and Characteristics of Shapes
1.3.2 More Characteristics of Shapes
Chapter Closure
Section 2.1
2.1.1 Complementary, Supplementary, and Vertical Angles
2.1.2 Angles Formed by Transversals
2.1.3 More Angles Formed by Transversals
2.1.4 Angles in a Triangle
2.1.5 Applying Angle Relationships
Section 2.2
2.2.1 Units of Measure
2.2.2 Areas of Triangles and Composite Shapes
2.2.3 Areas of Parallelograms and Trapezoids
2.2.4 Heights and Areas
Section 2.3
2.3.1 Triangle Inequality
2.3.2 The Pythagorean Theorem
Chapter Closure
Section 3.1
3.1.1 Dilations
3.1.2 Similarity
3.1.3 Using Ratios of Similarity
3.1.4 Applications and Notation
Section 3.2
3.2.1 Conditions for Triangle Similarity
3.2.2 Creating a Flowchart
3.2.3 Triangle Similarity and Congruence
3.2.4 More Conditions for TriangleSimilarity
3.2.5 Determining Similarity
3.2.6 Applying Similarity
Chapter Closure
Section 4.1
4.1.1 Constant Ratios in Right Triangles
4.1.2 Connecting Slope Ratios to Specific Angles
4.1.3 Expanding the Trig Table
4.1.4 The Tangent Ratio
4.1.5 Applying the Tangent Ratio
Section 4.2
4.2.1 Using an Area Model
4.2.2 Using a Tree Diagram
4.2.3 Probability Models
4.2.4 Unions, Intersections, and Complements
4.2.5 Expected Value
Chapter Closure
Section 5.1
5.1.1 Sine and Cosine Ratios
5.1.2 Selecting a Trig Tool
5.1.3 Inverse Trigonometry
5.1.4 Applications
Section 5.2
5.2.1 Special Right Triangles
5.2.2 Pythagorean Triples
Section 5.3
5.3.1 Finding Missing Parts of Triangles
5.3.2 Law of Sines
5.3.3 Law of Cosines
5.3.4 Ambiguous Triangles(Optional)
5.3.5 Choosing a Tool
Chapter Closure
Section 6.1
6.1.1 Congruent Triangles3
6.1.2 Conditions for Triangle Congruence
6.1.3 Congruence of Triangles Through Rigid Transformations3526.1.4Flowcharts for Congruence
6.1.5 Converses
Section 6.2
6.2.1 Angles on a Pool Table
6.2.2 Investigating a Triangle
6.2.3 Creating a Mathematical Model
6.2.4 Analyzing a Game’
6.2.5 Using Transformations and Symmetry to Design Snowflakes
Chapter Closure
Section 7.1
7.1.1 Properties of a Circle
7.1.2 Building a Tetrahedron
7.1.3 Shortest Distance Problems
7.1.4 Using Symmetry to Study Polygons
Section 7.2
7.2.1 Special Quadrilaterals and Proof
7.2.2 Properties of Rhombi
7.2.3 More Proofswith Congruent Triangles
7.2.4 MoreProperties of Quadrilaterals
7.2.5 Two-Column Proofs
7.2.6 Explore-Conjecture-Prove
Section 7.3
7.3.1 Studying Quadrilaterals on a Coordinate Grid
7.3.2 Coordinate Geometry and Midpoints
7.3.3 Identifying Quadrilaterals on a Coordinate Grid
Chapter Closure
Section 8.1
8.1.1 Pinwheels and Polygons
8.1.2 Interior Angles of Polygons
8.1.3 Angles of Regular Polygons
8.1.4 Regular Polygon Angle Connections
8.1.5 Finding Areas of Regular Polygons
Section 8.2
8.2.1 Area Ratios of Similar Figures
8.2.2 Ratios of Similarity
Section 8.3
8.3.1 A Special Ratio
8.3.2 Area and Circumference of a Circle
8.3.3 Circles in Context
Chapter Closure
Section 9.1
9.1.1 Three-Dimensional Solids
9.1.2 Volumesand Surface Areas of Prisms
9.1.3 Prisms and Cylinders
9.1.4 Volumes of Similar Solids
9.1.5 Ratios of Similarity
Section 9.2
9.2.1 Introduction to Constructions
9.2.2 Constructing Bisectors
9.2.3 More Explorations with Constructions
9.2.4 Other Constructions
Chapter Closure
Section 10.1
10.1.1 Introduction to Chords
10.1.2 Angles and Arcs
10.1.3 Chords and Angles
10.1.4 Tangents and Secants
10.1.5 Problem Solving with Circles
Section 10.2
10.2.1 Conditional Probability and Independence
10.2.2 Two-Way Tables
10.2.3 Applications of Probability
Section 10.3
10.3.1 The Fundamental Principle of Counting
10.3.2 Permutations
10.3.3 Combinations
10.3.4 Categorizing Counting Problems
10.3.5 Some Challenging Probability Problems
Chapter Closure
Section 11.1
11.1.1 Platonic Solids
11.1.2 Pyramids
11.1.3 Volume of a Pyramid
11.1.4 Surface Area and Volume of a Cone
11.1.5 Surface Area and Volume of a Sphere
Section 11.2
11.2.1 Coordinates on a Sphere
11.2.2 Tangents and Arcs
11.2.3 Secant and Tangent Relationships
Chapter Closure
Section 12.1
12.1.1 The Equation of a Circle
12.1.2 Completing the Square for Equations of Circles
12.1.3 Introduction to Conic Sections
12.1.4 Graphing a ParabolaUsing the Focus and Directrix
Section 12.2
12.2.1 Using Coordinate Geometry and Constructions to Explore Shapes
12.2.2 Euler’s Formula for Polyhedra
12.2.3 The Golden Ratio
12.2.4 Using Geometry to find Probabilities
Chapter Closure
Section 1.1
1.1.1 Solving Puzzles in Teams
1.1.2 Using a Graphing Calculator to Explore a Function
1.1.3 Domain and Range
1.1.4 Points of Intersection in Multiple Representations
Section 1.2
1.2.1 Modeling a Geometric Relationship
1.2.2 Function Investigation
1.2.3 The Family of Linear Functions
1.2.4 Function Investigation Challenge
Chapter Closure
Section 2.1
2.1.1 Modeling Non-Linear Data
2.1.2 Parabola Investigation
2.1.3 Graphing a Parabola Without a Table
2.1.4 Rewriting in Graphing Form
2.1.5 Mathematical Modeling with Parabolas
Section 2.2
2.2.1 Transforming Other Parent Graphs
2.2.2 Describing (h,k) for Each Family of Functions
2.2.3 Transformations of Functions
2.2.4 Transforming Non-Functions
2.2.5 Transforming Piecewise-Defined Functions
Chapter Closur
Section 3.1
3.1.1 Equivalent Expressions
3.1.2 Rewriting Expressions and Determining Equivalence
3.1.3 Solving by Rewriting
Section 3.2
3.2.1 Investigating Rational Functions
3.2.2 Simplifying Rational Expressions
3.2.3 Multiplying and Dividing Rational Expressions
3.2.4 Adding and Subtracting Rational Expressions
3.2.5 Creating New Functions
Chapter Closure
Section 4.1
4.1.1 Strategies for Solving Equations
4.1.2 Solving Equations and Systems Graphically
4.1.3 Finding Multiple Solutions to Systems of Equations
4.1.4 Using Systems of Equations to Solve Problems
Section 4.2
4.2.1 Solving Inequalities with One or Two Variables
4.2.2 Using Systems to Solve a Problem
4.2.3 Application of Systems of Linear Inequalities
4.2.4 Using Graphs to Find Solutions
Chapter Closure
Section 5.1
5.1.1 “Undo” Equations
5.1.2 Using a Graph to Find an Inverse
5.1.3 Finding Inverses and Justifying Algebraically
Section 5.2
5.2.1 Finding the Inverse of an Exponential Function
5.2.2 Defining the Inverse of an Exponential Function
5.2.3 Investigating the Family of Logarithmic Functions
5.2.4 Transformations of Logarithmic Functions
5.2.5 Investigating Compositions of Functions
Chapter Closure
Section 6.1
6.1.1 Creating a Three-Dimensional Model
6.1.2 Graphing Equations in Three Dimensions
6.1.3 Systems of Three-Variable Equations2666.1.4Solving Systems of Three Equations with Three Unknowns
6.1.5 Using Systems of Three Equations for Curve Fitting
Section 6.2
6.2.1 Using Logarithms to Solve Exponential Equations
6.2.2 Investigating the Properties of Logarithms
6.2.3 Writing Equations of Exponential Functions
6.2.4 An Application of Logarithms
Chapter Closure
Section 7.1
7.1.1 Introduction to Cyclic Models
7.1.2 Graphing the Sine Function
7.1.3 Unit Circle ↔Graph
7.1.4 Graphing and Interpreting the Cosine Function
7.1.5 Defining a Radian
7.1.6 Building a Unit Circle
7.1.7 The Tangent Function
Section 7.2 7.2.1 Transformations of y= sin x
7.2.2 One More Parameter for a Cyclic Function
7.2.3 Period of a Cyclic Function
7.2.4 Graph ↔Equation
Chapter Closure
Section 8.1
8.1.1 Sketching Graphs of Polynomial Functions
8.1.2 More Graphs of Polynomials
8.1.3 Stretch Factorsfor Polynomial Functions
Section 8.2
8.2.1 Introducing Imaginary Numbers
8.2.2 Complex Roots
8.2.3 More Complex Numbers and Equations
Section 8.3
8.3.1 Polynomial Division
8.3.2 Factors and Integral Roots
8.3.3 An Application of Polynomials
Chapter Closure
Section 9.1
9.1.1 Survey Design4
9.1.2 Samples and the Role of Randomness
9.1.3 Bias in Convenience Samples
Section 9.2
9.2.1 Testing Causeand Effect with Experiments
9.2.2 Conclusions From Studies
Section 9.3
9.3.1 Relative Frequency Histograms
9.3.2 The Normal Probability Density Function
9.3.3 Percentiles
Chapter Closure
Section 10.1
10.1.1 Introduction to Arithmetic Series
10.1.2 More Arithmetic Series
10.1.3 General Arithmetic Series
10.1.4 Summation Notation and Combinations of Series
Section 10.2
10.2.1 Geometric Series
10.2.2 Infinite Series
Section 10.3
10.3.1 Pascal’s Triangle and the Binomial Theorem
10.3.2 TheNumber e
Chapter Closure
Section 11.1
11.1.1 Simulations of Probability
11.1.2 More Simulations of Probability
11.1.3 Simulating Sampling Variability
Section 11.2
11.2.1 Statistical Test Using Sampling Variability
11.2.2 Variability in Experimental Results
11.2.3 Quality Control
11.2.4 Statistical Process Control
Section11.3
11.3.1 Analyzing Decisions and Strategies
Chapter Closure
Section 12.1
12.1.1 Analyzing Trigonometric Equations
12.1.2 Solutions to Trigonometric Equations
12.1.3 Inverses of Trigonometric Functions
12.1.4 Reciprocal Trigonometric Functions
Section 12.2
12.2.1 Trigonometric Identities
12.2.2 Proving Trigonometric Identities
12.2.3 Angle Sum and Difference Identities
Chapter Closure
Section A.1
A.1.1 Representing Exponential Growth
A.1.2 Rebound Ratios
A.1.3 The Bouncing Ball and Exponential Decay
Section A.2
A.2.1 Generating and Investigating Sequences
A.2.2 Generalizing Arithmetic Sequences
A.2.3 Recursive Sequences
Section A.3
A.3.1 Patterns of Growth in Tables and Graphs
A.3.2 Using Multipliers to Solve Problems
A.3.3 Comparing Sequences to Functions
Appendix Closure
Section B.1
B.1.1 Investigation y = bx
B.1.2 Multiple Representations of Exponential Functions
B.1.3 More Applications of Exponential Growth
B.1.4 Exponential Decay
B.1.5 Graph → Equation
B.1.6 Completing the Multiple Representations Web
Section B.2
B.2.1 Curve Fitting and Fractional Exponents
B.2.2 More Curve Fitting
B.2.3 Solving a System of Exponential Functions Graphically
Appendix Closure
Section C.1
C.1.1 Investigating Data Representations
C.1.2 Comparing Data
C.1.3 Standard Deviation
Appendix Closure
CP 1: Using Place Value to Round and Compare Decimals
CP 2: Addition and Subtraction of Decimals
CP 3: Addition and Subtraction of Fractions
CP 4: Addition and Subtraction of Mixed Numbers
CP 5: Multiple Representations of Portions
P 6: Locating Points on a Number Line and on a Coordinate Graph
CP 7A: Multiplication of Fractions and Decimals
CP 7B: Area and Perimeter of Quadrilaterals and Triangles
CP 8A: Rewriting and Evaluating Variable Expressions
CP 8B: Division of Fractions and Decimals
CP 9A: Displays of Data: Histograms and Box Plots
CP 9B: Solving One-Step Equations
Section 6.1
6.1.1 Comparing Expressions
6.1.2 Comparing Quantities with Variables
6.1.3 One Variable Inequalities
6.1.4 Solving One Variable Inequalities
Section 6.2
6.2.1 Solving Equations
6.2.2 Checking Solutions and the Distributive Property
6.2.3 Solving Equations and Recording Work
6.2.4 Using a Table to Write Equations from Word Problems
6.2.5 Writing and Solving Equations
6.2.6 Cases with Infinite or No Solutions
6.2.7 Choosing a Solving Strategy
Chapter Closure
Section 7.1
7.1.1 Distance, Rate, and Time
7.1.2 Scaling Quantities
7.1.3 Solving Problems Involving Percents
7.1.4 Equations with Fraction and Decimal Coefficients
7.1.5 Creating Integer Coefficients
7.1.6 Creating Integer Coefficients Efficiently
7.1.7 Percent Increase and Decrease
7.1.8 Simple Interest
Section 7.2
7.2.1 Finding Missing Information in Proportional Relationships
7.2.2 Solving Proportions
Chapter Closure
Section 8.1
8.1.1 Measurement Precision
8.1.2 Comparing Distributions
Section 8.2
8.2.1 Representative Samples
8.2.2 Inference from Random Samples
Section 8.3
8.3.1 Introduction to Angles
8.3.2 Classifying Angles
8.3.3 Constructing Shapes
8.3.4 Building Triangles
Chapter Closure
Section 9.1
9.1.1 Circumference, Diameter, and Pi
9.1.2 Area of Circles
9.1.3 Area of Composite Shapes
Section 9.2
9.2.1 Surface Area and Volume
9.2.2 Cross Sections
9.2.3 Volume of a Prism
9.2.4 Volume of Non-Rectangular Prisms
Chapter Closure
Section 9.3
9.3.1 Volume and Scaling
9.3.2 Using Multiple Math Ideas to Create an Interior Design
9.3.3 Applying Ratios
Checkpoint 1: Area and Perimeter of Polygons
Checkpoint 2: Multiple Representations of Portions
Checkpoint 3: Multiplying Fractions and Decimals
Checkpoint 5: Order of Operations
Checkpoint 6: Writing and Evaluating Algebraic Expressions
Checkpoint 7A: Simplifying Expressions
Checkpoint 7B: Displays of Data: Histograms and Box Plots
Checkpoint 8: Solving Multi-Step Equations
Checkpoint 9: Unit Rates and Proportions
Section 6.1
6.1.1 Rigid Transformations
6.1.2 Rigid Transformations on a Coordinate Graph
6.1.3 Describing Transformations
6.1.4 Using Rigid Transformations
Section 6.2
6.2.1 Multiplication and Dilation
6.2.2 Dilations and Similar Figures
6.2.3 Identifying Similar Shapes
6.2.4 Similar Figures and Transformations
6.2.5 Working With Corresponding Sides
6.2.6 Solving Problems Involving Similar Shapes
Chapter Closure
Section 7.1
7.1.1 Circle Graphs
7.1.2 Organizing Data in a Scatterplot
7.1.3 Identifying and Describing Association
Section 7.2
7.2.1 y = mx + b Revisited
7.2.2 Slope
7.2.3 Slope in Different Representations
7.2.4 More About Slope
7.2.5 Proportional Equations
Section 7.3
7.3.1 Using Equations to Make Predictions
7.3.2 Describing Association Fully
7.3.3 Association Between Categorical Variables
Chapter Closure
Section 8.1
8.1.1 Patterns of Growth in Tables and Graphs
8.1.2 Compound Interest
8.1.3 Linear and Exponential Growth
Section 8.2
8.2.1 Exponents and Scientific Notation
8.2.2 Exponent Rules
8.2.3 Negative Exponents
8.2.4 Operations with Scientific Notation
Section 8.3
8.3.1 Functions in Graphs and Tables
Chapter Closure
Section 9.1
9.1.1 Parallel Line Angle Pair Relationships
9.1.2 Finding Unknown Angles in Triangles
9.1.3 Exterior Angles in Triangles
9.1.4 AA Triangle Similarity
Section 9.2
9.2.1 Side Lengths and Triangles
9.2.2 Pythagorean Theorem
9.2.3 Understanding Square Root
9.2.4 Real Numbers
9.2.5 Applications of the Pythagorean Theorem
9.2.6 Pythagorean Theorem in Three Dimensions
9.2.7 Pythagorean Theorem Proofs
Chapter Closure
Section 10.1
10.1.1 Cube Roots
10.1.2 Surface Area and Volume of a Cylinder
10.1.3 Volumes of Cones and Pyramids
10.1.4 Volume of a Sphere
10.1.5 Applications of Volume
Chapter Closure
10.2.1 Indirect Measurement
10.2.2 Finding Unknowns
10.2.3 Analyzing Data to Identify a Trend
1. Operations with Signed Fractions and Decimals
2. Evaluating Expressions and Using Order of Operations
3. Unit Rates and Proportions
4. Area and Perimeter of Circles and Composite Figures
5. Solving Equations
6. Multiple Representations of Linear Equations
7. Solving Equations with Fractions and Decimals (Fraction Busters)
8. Transformations
9. Scatterplots and Association
0.1.1
Who are my classmates?
0.1.2
How do I work collaboratively?
0.1.3
What questions can I ask?
0.1.4
How can I categorize my words?
0.1.5
How can I communicate my ideas?
0.1.6
How can the team build this together?
0.1.7
What do we need to work togethe
1.1 Numbers and Data
1.1.1 How should data be placed on this line?
1.1.2 Where do these numbers belong on this line?
1.1.3 How can I use two lines to solve problems?
1.1.4 How can data be used to answer a question?
1.1.5 How are histograms helpful?
1.1.6 How else can data be displayed?
1.2 Shapes and Area,
1.2.1 How can I write equivalent expressions in area and perimeter?
1.2.2 What shapes make up the polygon?
1.2.3 How can I make it a rectangle?
1.3 Expressions
1.3.1 How can I describe it using symbols?
1.3.2 What are the parts of an expression?
1.3.3 How do I work with decimals?
1.3.4 How do I multiply multi-digit decimals?
1.3.5 How can I represent the arrangement?
2.1 Ratio Language
2.1.1 How can I compare two quantities?
2.1.2 How can I write ratios?
2.1.3 How can I see ratios in data representations?
2.2 Equivalent Ratios
2.2.1 How can I visualize ratios?
2.2.2 How can I see equivalent ratios in a table?
2.2.3 How can I see equivalent ratios in a double number line?
2.2.4 How can I see equivalent ratios in tape diagrams?
2.2.5 How can I use equivalent ratios?
2.2.6 What do these represent?
2.3 Measurement
2.3.1 What are the measurements?
2.3.2 What are the units?
2.3.3 How can I convert units
3.1 Measures of Center
3.1.1 How can I measure the center?
3.1.2 How else can I measure the center?
3.1.3 Which is the better measure of center?
3.1.4 What happens when I change the data?
3.2 Integers
3.2.1 What numbers do I see?
3.2.2 What number is this?
3.2.3 What does a number line say about a number?
3.2.4 How do I compare different types of numbers?
3.3 Absolute Value
3.3.1 How do I describe the location?
3.3.2 How far do I walk?
3.3.3 Which one is greater?
3.3.4 How do I communicate mathematically?
3.4 Coordinate Plane
3.4.1 How can you precisely indicate a location?
3.4.2 What is the correct order?
3.4.3bWhat symbol represents me?
4.1 Fractions, Decimals, and Percents
4.1.1 How can I tell if the ratios are equal?
4.1.2 What does “percent” mean?
4.1.3 How can I convert a fraction?
4.1.4 How can I convert a percent?
4.1.5 How can I convert a decimal?
5.1 Variation in Data
5.1.1 How do I ask a statistical question?
5.1.2 What does each representation say about the data?
5.1.3 What does the box in a box plot represent?
5.1.4 How else can I describe data?
5.2 Area
5.2.1 What is the height?
5.2.2 Can I reconfigure a parallelogram into a rectangle?
5.2.3 How do I calculate the area?
5.2.4 How many triangles do I need?
5.2.5 What is my perspective?
5.2.6 Is it fair to play by the rules?
5.2.7 What shapes do I see?
5.3 Fractions
5.3.1 How can I represent fraction multiplication?
5.3.2 How can I multiply fractions?
5.3.3 How can I multiply mixed numbers?
6.1 Rules of Operations
6.1.1 What does it mean?
6.1.2 What do mathematicians call this?
6.1.3 How much should I ask for?
6.1.4 How can I write mathematical expressions?
6.1.5 How do mathematicians abbreviate?
6.1.6 In what order should I evaluate?
6.2 Multiples and Factors
6.2.1 When will they be the same?
6.2.2 What are multiples?
6.2.3 What do they have in common?
6.2.4 Who is your secret valentine?
6.2.5 How can I understand products?
6.2.6 How can I rewrite expressions?
6.2.7 Which method do I use?
7.1 Whole Number and Decimal Division
7.1.1 How can I share equally?
7.1.2 Which strategy is the most efficient?
7.1.3 How can I write the number sentence?
7.1.4 How can I divide decimals?
7.1.5 How should the problem be arranged?
7.2 Fraction Division
7.2.1 What if the divisor is a fraction?
7.2.2 How many fit?
7.2.3 How can I visualize this?
7.2.4 What is common about this?
7.2.5 How can I use a Giant One?
7.2.6 Which method is most efficient?
8.1. Algebra Tiles
8.1.1 What do these shapes represent?
8.1.2 What does a group of tiles represent?
8.1.3 What is an equivalent expression?
8.1.4 Which terms can be combined?
8.1.5 What do the numbers mean?
8.1.6 What can a variable represent?
8.2 Expressions
8.2.1 How can I count it?
8.2.2 What if the size of the pool is unknown?
8.2.3 How can I use an algebraic expression?
8.3 Equations and Inequalities
8.3.1 Which values make the equation true?
8.3.2 How can patterns be represented?
8.3.3 What is the equation?
8.3.4 How many could there be?
0.1.1 What do they have in common?
0.1.2 How can I effectively communicate with my team?
0.1.3 Is there another perspective?
0.1.4 How can I persevere through struggle?
0.1.5 How can I see this happening?
0.1.6 What patterns can I recognize?
0.1.7 What is the best strategy?
0.1.8 How does respect look?
1.1 Data and Graphs
1.1.1 How can I represent data?
1.1.2 How can I use data to solve a problem?
1.1.3 Is the roller coaster safe?
1.1.4 Is there a relationship?
1.1.5 What is the relationship?
This professional learning is designed for teachers as they begin their implementation of CPM. This series contains multiple components and is grounded in multiple active experiences delivered over the first year. This learning experience will encourage teachers to adjust their instructional practices, expand their content knowledge, and challenge their beliefs about teaching and learning. Teachers and leaders will gain first-hand experience with CPM with emphasis on what they will be teaching. Throughout this series educators will experience the mathematics, consider instructional practices, and learn about the classroom environment necessary for a successful implementation of CPM curriculum resources.
Page 2 of the Professional Learning Progression (PDF) describes all of the components of this learning event and the additional support available. Teachers new to a course, but have previously attended Foundations for Implementation, can choose to engage in the course Content Modules in the Professional Learning Portal rather than attending the entire series of learning events again.