Leah Gaines, Blacklick, OH leahgaines@cpm.org
Social justice is a difficult topic to broach in your classroom. The subject of social justice is highly politicized, and there is a deep division in this country related to views about social justice. One way to have these tough, necessary conversations with students is through data. Looking at the data surrounding social justice topics helps to minimize emotion and opinions in the conversation and allows students and teachers to focus on the factual evidence. Also, focusing on data that directly impacts your students and/or their community helps students see themselves in the data and have empathy for each situation, which will empower them to make changes for the better.
A great way to get students looking at and thinking about data is through visual representations. The following are a few examples of data representations focused on issues of social justice along with questions you could use for a class discussion. These questions are here as a starting point. The questions should be altered to fit your grade level and, more specifically, the mathematical topics and standards your students are currently working on or are already familiar with.
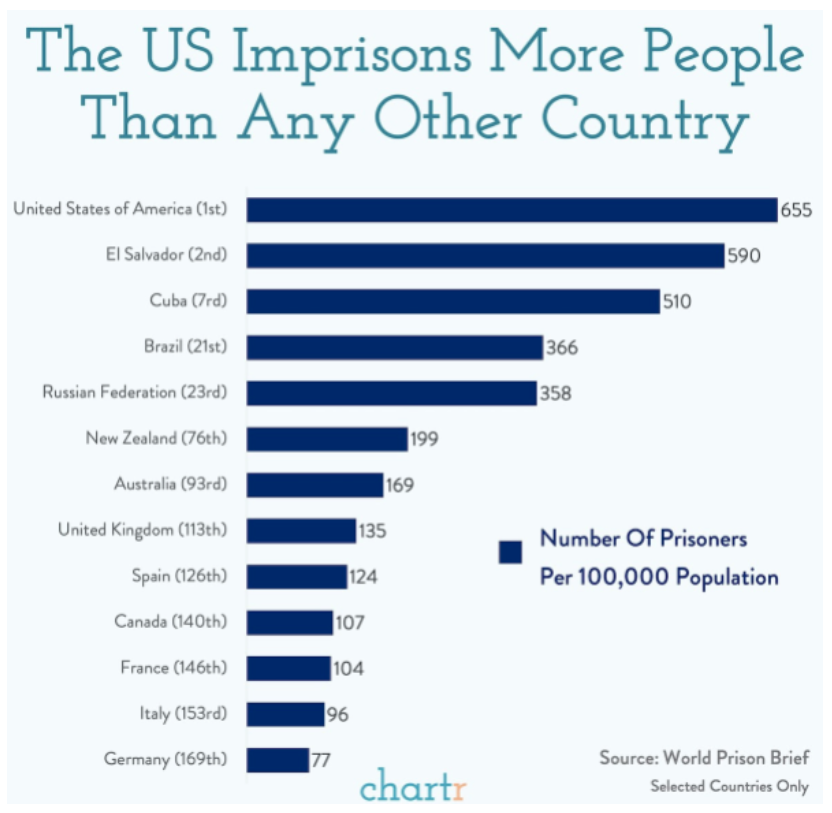
Questions you could ask about this representation:
- What do the numbers mean at the end of each bar?
This question helps direct students toward the key that shows that the numbers represent the number of prisoners per 100,000 population. This could lead into a conversation about rates, ratios, or percentages. Discuss with students that this means the numbers are an accurate comparison between countries (e.g., the fact that the US number is higher is unrelated to its population size).
- What is shown by the order the countries are listed in?
It shows their rank among other countries’ rate of prisoners. Students should notice that the US is ranked first, and that the countries listed are of various ranks; that is, they are not in order. Students may wonder why only certain countries are listed. One idea is that the graph is trying to compare certain types of countries. You can find the full data set to investigate further.
- What is the source of this data?
In the bottom right corner students can see that the data comes from World Prison Brief. This would be a good place to integrate social studies and/or language arts to discuss reliable sources.
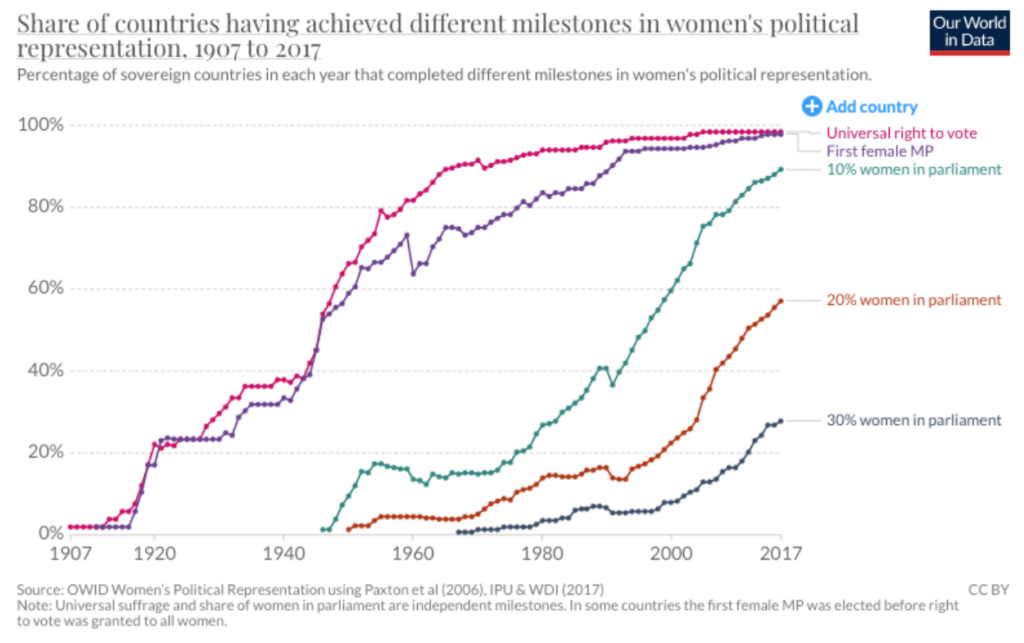
Questions you could ask about this representation:
- What do the percentages mean?
This question should guide students to read the title and subtitle of the graph to understand that it is the percent of countries that have completed milestones in women’s political representation. Those milestones are listed on the right. You could integrate social studies here to discuss what parliament is and its equivalent in the US.
- How could this data be used?
Answers will vary widely here, and therefore, this is an opportunity for a rich and open discussion. When a student suggests how the data might be used, ask with the follow-up question, Why would they WANT to use this data? Or, How would that group use the data?
- What trends do you see in the data? What do those trends mean?
Each line seems to be trending upward, which means a positive gain in women’s political representation across the world. You could continue this conversation with students by taking a look at the specific numbers of women in parliament in each country.
Questions you could ask about this representation:
- What do the different colors of each country represent?
Each color is a different year, so each country was assigned a color to match the year it legalized gay marriage. Additionally, students might notice that the colors are the colors of the rainbow, to match the pride flag.
- If you saw this representation in 2010, how would it be different?
In 2010 there were only 10 countries that had legaliized gay marriage, so the graphical representation would look much more sparse. Being able to visualize how representations would change if the data was altered is an important skill for students to practice. It gives them a deeper understanding of the data and how its story can be told through the representation.
- What other representation(s) could be used to display this data?
Answers will vary here, but the main idea is for students to think about how percentages can be represented and how a representation works to tell the story about the data. Some examples include: a bar graph that shows the number of countries each year that have legalized gay marriage, or a line graph that shows the trend in the total number of countries that have legalized gay marriage.
Keep the conversation going! Use the resources below to find more data representations to use in your classroom:
Our World in Data: Interactive data representations covering a wide range of global issues.
Bureau of Labor Statistics: databases, tables, and calculators for things like inflation, unemployment, wages, etc.
United States Census Bureau Data Visualization Gallery & Data Mapper: interesting graphics based on Census data that you can tailor to your geographic area or topic of interest.
World Prison Brief: data on world prison systems. The UN refugee agency: Data and graphics about displaced persons, refugees, current conflicts, etc.
Pew Research Center: Data with articles, graphs, tables and additional information on a wide variety of topics from social trends to religion to science.