Tom’s Problems as a Way to Keep Your Passion for Mathematics Alive Throughout Your Career

May 2024

Want to see a bunch of secondary mathematics teachers having fun? Watch them as they grapple with a newly crafted, powerful mathematical puzzle and playfully uncover layer upon layer of hidden connections and relationships. The excitement of each new surprise is only surpassed by the anticipation of making sense of the next mathematical challenge unveiled. Every Tom’s Problem that we have had the pleasure to work on (more than a dozen for Mark and three for Lara) has been an experience of joy.

What is a Tom’s Problem? (Mark)

As mathematics teachers, we feel fortunate to have the opportunity to share our passion for mathematics with the next generation of problem-solvers. But with the 1,000 + 1 + … classroom tasks that demand attention in the secondary mathematics classroom, precious little time is left for us to experience the joy of problem-solving ourselves. How often do we get to explore complex, novel math problems? Beyond allowing us to experience the joy of problem-solving again, engaging in authentic, collaborative problem-solving with colleagues can also allow us to take a deep dive into our pedagogy. We think it is a gift to experience the same rough draft thinking and productive struggle that we challenge our students with every day because engaging in those activities is what it means to actually do mathematics

To refresh those feelings of joyful play with mathematics, the late Dr. Tom Sallee (CPM co-founder) offered a tantalizing math problem to all the members of the CPM team at our annual Summer Leadership Institutes. For more than 20 years, Tom would craft an original, complex problem that had the following attributes. 

  • The problem to be solved was either embedded in an interesting and inviting story (2019, Lighting Candles) or was worked into a generally recognized pattern/puzzle (2014, Strange and Wonderful Magic Squares). Such contexts could be quickly connected to cultural touchstones that were widely shared.   
  • Whether teaching 6th-grade math or AP Calculus, everyone in the room had plenty to notice and wonder as the initial question or prompt was discussed. Almost immediately, every team would be engaged in an energized, quality conversation, and soon they would realize that any thoughts of an immediate solution could be tabled—Tom had not made this an easy row to hoe!  
  • Almost like clockwork, a quarter-hour of team consultation would yield another realization about Tom’s Problem; there were multiple pathways forward to explore. By this point, nearly every team in the room had developed an appreciation for the twists, turns, and strategic entanglement encompassed within this math problem. 
  • The satisfaction of productive struggle would become tangible as “aha” moments fueled teams to growing levels of excitement. These fresh insights not only fostered intellectual thrill but also created newfound connections across mathematical topics. The cycle of challenge and triumph was integral to each step forward, and with each new accomplishment came a new question posed by the facilitator. 
  • And of course, as with all math tasks, Tom’s Problem would routinely tap into many (if not all) of the eight Standards for Mathematical Practice, as well as the process standards of problem-solving, reasoning and proof, communication, representation, and connections.   

Follow this link for a small sampling of Tom’s Problems: Tom’s Problems.


What is it like to experience a Tom’s Problem? (Lara) 

After participating in Mark and Ben’s Tom’s Problems session at the 2024 Teacher Conference, I wrote down some reflections to capture my experience. An edited version follows. Throughout this reflection, I’ve “coded” some of my reflections as mathematical insights and pedagogical insights.

As the Tom’s Problem session started, I was feeling excited and so was more social than I usually would be. I asked my tablemates, Rob (he/him) and Sam (they/theirs) why they had chosen this session, and they both said it was to have fun! Me too! They said they had attended the session last year and really enjoyed it, and so were here again. They didn’t already know each other, which made me grateful for the random grouping as it can be hard to integrate into a team of folks who have a history of already working together. 

After doing an icebreaker with our teams, Mark pulled us back together for the much-anticipated moment… THE PROBLEM! Mark promised us that we would not finish, and that made me feel grateful because there was no way to be behind. 

The problem was about music! I immediately felt a sense of appreciation for the icebreaker activities, which were also about music. Mark introduced the problem by sharing that his grandchildren, Oliver and Levi, were playing two different musical instruments and he had been working with them to figure out how many different sounds they could make. Mark’s son, Ben (a mathematician and Oliver and Levi’s dad), then used a metronome to lead the group through clapping together on each beat, then having half the group clap on both beats and half the group snap on only beat 1. It was physically and/or mentally challenging for me not to snap on every beat! I drew heavily on this experience when doing the task.

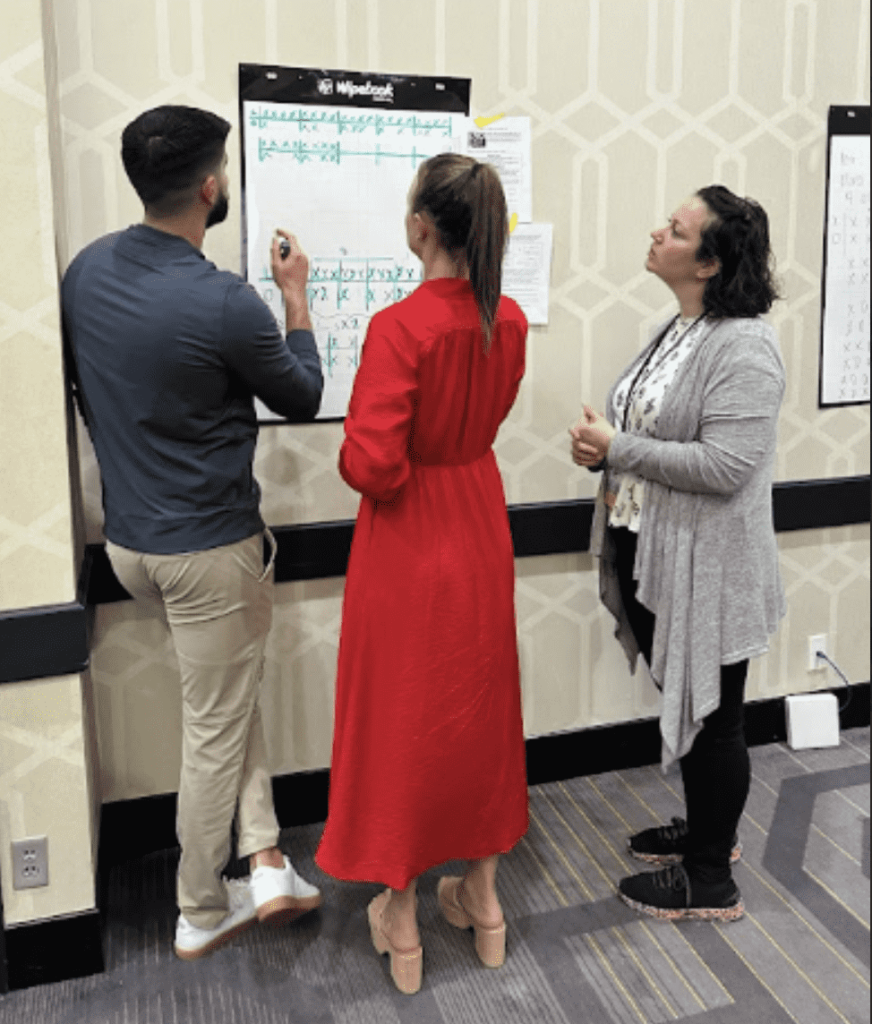
Mark then introduced our first task: How many different 2-beat measures are possible when both people have to play the first beat? (a paraphrase). He then moved us to the VNPSs/Wipebooks. My team started by creating a table that ignored the first beat and found an “answer” quickly. When we called Mark over to check our work, he asked us to consider the first beat, so we revised our diagram. This led us to realize that our first measure was redundant with a 1-beat measure, meaning that it sounded just the same as clapping on each tick of the metronome. When Mark saw this, he gave us a new handout that had a version of our table on it. 

We then followed a prompt to investigate how many unique (non-redundant) 3-beat measures were possible. I continued to hold the marker for the 3-beat measure investigation.

***

After completing the table for 3-beat measures, we began looking for PATTERNS! At this point, Rob was called up by Mark to participate in a Huddle. He later reflected on how he felt lost when he returned from the Huddle because our pattern-finding conversation had taken off without him. He said he hadn’t considered how going to a Huddle could disadvantage students getting left behind in conversations. This felt like an “aha” moment for me too, because I always think of Huddles as a way to boost a student’s status by giving them information and letting them come back to the group as experts. His experience challenged my thinking, and I apologized for not bringing him into our conversation when he returned!

During our pattern-finding conversation, we made many conjectures and created a table to keep track of patterns we noticed. I also marked up the table as we talked about patterns. I felt eager to find a pattern, but also knew I would have to be patient as we probably didn’t have enough data yet. Sam expressed similar feelings—we needed to get to the 4-beat measure to get more data.  

***

Our next task was to investigate how many different 4-beat measures we could create. Even without reading the rest of the prompt, we knew we were headed toward finding something generalizable for n-beat measures. 

I had been holding the marker for a while, so I suggested that I hand it off to someone else. Rob agreed and took over responsibility for recording our ideas. Even though I really enjoyed being the one with the marker, I was grateful to have passed it; Rob was much faster and more confident than I in recording different measures, and did so without consulting us. I was humbled by his speed and self-assuredness. For a moment I was surprised at his confidence to move forward so quickly without us, but I tolerated it and then quickly moved into gratefulness. I began to feel like this was grunt work rather than the actual mathematics at this point, and that Rob was doing us a favor. With the 2- and 3-beat measures, recording the different measures did feel like part of the mathematical work. I think by the time the 4-beat measures came along, we were all ready to get to finding the pattern. 

As Rob continued writing different 4-beat measures, Sam and I began discussing how many redundant measures the 4-beat measure would have. They had some experience with music and so were better able to interpret the task than I was. At some point, they were called up by Mark using their team role and they returned telling us that we could spy on another team’s work. I was having fun and didn’t want to break to spy, but they brought it up several times and eventually said that while we continued what we were doing, they would quickly spy on other teams. 

I asked Rob to draw a dotted line down the middle of the 4-beat measure—in the midline of the 4 gridline squares of the VNPS. This made it almost trivially easy for us to identify the measures that were redundant with the 2-beat measures. 

We only got to the place where we could identify one 4-beat measure that would be redundant with a 2-beat measure before Mark called us back to our tables. I continued thinking as Mark was talking because I was consumed with my conjecture. I saw Sam nodding along and realized they had probably made more connections or conjectures than I had. But my thoughts were still swirling! As I sat quietly, I made some progress assuring myself my conjecture was true. That felt better! 

Feeling like I was on to something, I approached Ben after the session to share my ideas. I wanted to know if I had the right “answer” (Was this even an “answer” to the questions that were posed on the handout? I didn’t and still don’t know!), but I think I just shared my idea. He simply said, “That seems like a reasonable conjecture,” and smiled. So, I didn’t get a pat on the back, but encouragement to continue exploring. 

Which is precisely what I did that night and several nights later! 

Final words: I find the spiral between what is and what isn’t the math to be entertaining; I find humor and pleasure in it. It is fun to be able to return to previously unimportant ideas or processes to find out just how important they are. But, how could we have known that without continuing our journey? Perhaps other teams realized it before we did, but I think there was so much interesting mathematics happening in this problem that there are probably lots of interesting ideas to latch on to and paths to pursue. I probably would have learned more about that if I had been better able to focus on the whole group discussion and stop thinking about my conjecture! I don’t know that I’ll continue trying to solve this problem, but I don’t know that I won’t either. I do know that I can’t get it out of my head!


What do teachers say about participating in a Tom’s Problem session? (Mark)

As you might imagine, inviting secondary mathematics teachers to a problem-solving party is like gathering a gaze of raccoons for a grape-eating event—no one can get enough and they won’t stop until finished! Common words and phrases that participants used in their feedback form to describe the activity included the following: “fun,” “enjoyable,” “engaging,” “good conversations,” “collaborative,” and “challenging.” When teachers were asked to share highlights of the learning experience, they provided the following:

  • Loved that we did a problem that we did not solve!
  • Involving music and math together made the problem even more accessible for everyone.
  • I loved being challenged and working with others.
  • Always love the productive struggle to keep our minds sharp and learning.
  • Great to act as a student with a challenging problem.
  • My group was awesome.
  • I love this problem! It is really interesting and I am definitely going to continue working on it! And send it to my Dad!
  • I think Tom would be proud.

The number one wish reported was for more time. This bit of feedback is consistent with the desires expressed by teachers during more than two decades of Tom’s Problem sessions. Once engaged, there’s no turning back; problem-solving becomes a sacrosanct event, and asking teachers to stop usually triggers a mild uproar. 

Every Tom’s Problem session is a catalyst for original thinking. Participants offer fresh ideas and interpretations about the core mathematical concepts involved. New connections that were not anticipated by the authors often emerge. Also, helpful suggestions regarding teacher moves (as with “more check-ins early on”) are welcome and have a positive effect on the next presentation of the problem. 

What does this mean for you?

Fortunately for us, Tom Sallee found a way to support teachers as they walk the walk of learning new mathematics throughout their careers. As he facilitated these sessions, he observed hundreds of mathematics teachers exhibiting quite similar positivity when solving a seemingly insurmountable problem. He knew that most mathematics teachers share a passion for exploring the unknown, taking on a challenge, and seeking mathematical insight. Tom witnessed the joy shared by colleagues as they frolicked in his mathematical playground, enjoying a recess from the day-to-day demands of the secondary mathematics classroom. 

We have linked several Tom’s Problems, and we hope that you might take some time with your colleagues or friends to playfully explore them. We know you are busy, and we hope this feels like taking some time for some self-care rather than adding to your to-do list. If you need a little extra motivation, we think this kind of mathematical play both constitutes self-care and feeds your professional practice: we both agree that teachers’ sense of intellectual thriving is intimately tied to students’ enjoyment of mathematics. 

Picture of Mark Coté & Lara Jasien

Mark Coté & Lara Jasien

markcote@cpm.org
larajasien@cpm.org

Inspiring Connections
Course 1

Prelude

0.1.1 What do they have in common?
0.1.2 How can I effectively communicate with my team?
0.1.3 Is there another perspective?
0.1.4 How can I persevere through struggle?
0.1.5 How can I see this happening?
0.1.6 What patterns can I recognize?
0.1.7 What is the best strategy?
0.1.8 How does respect look?

Chapter 1

1.1 Proportions and Proportional Relationships
1.1.1 How can I determine the length?
1.1.2 How big is a million?
1.1.3 How can I predict the outcome?
1.1.4 What is your fair share?
1.1.5 How can I prove two ratios form a proportion?
1.1.6 What is the relationship between the numbers?
1.2 Integer Operations
1.2.1 How can I change temperatures?
1.2.2 How can I show my thinking?
1.2.3 How can adding zero help?
1.2.4 How can I multiply integers?
1.2.5 How can I divide integers?
1.2.6 How can I compose numbers?
1.2.7 What is My Number?
1.3 Proportions and Graphs
1.3.1 How can a graph tell a story?
1.3.2 How do graphs, scale, and proportions connect?

Chapter 2

2.1 Fraction and Decimal Conversions
2.1.1 How can I rewrite it?
2.1.2 How do I write it?
2.1.3 Which representations are equivalent?
2.2 Probability
2.2.1 Is it likely or unlikely?
2.2.2 How can I represent probability as a fraction, decimal, and percent?
2.2.3 How does probability work in real-world situations?
2.2.4 How can I predict the theoretical probability using experimental data?
2.3 Scale Drawings
2.3.1 How can I determine the distance?
2.3.2 How can I enlarge a shape?
2.3.3 Does that look right?
2.3.4 Is it a scaled copy?
2.3.5 What is the best scale?
2.4 Cross Sections
2.4.1 What do I see when I slice a three-dimensional object?
2.4.2 How are cross sections and volume related?

Chapter 3

3.1 Proportional Relationships
3.1.1 How does it grow?
3.1.2 How does the money grow?
3.1.3 Is this a proportional relationship?
3.1.4 How can I create a graph?
3.1.5 What do the points mean?
3.1.6 What connections can I make?
3.2 Data and Statistics: Using Samples to Make Predictions
3.2.1 What connections can I make?
3.2.2 Which sample is more accurate?
3.2.3 Does the sample represent the population?
3.2.4 How close is my sample?
3.2.5 How are the problems related?

Chapter 4

4.1 Multiple Representations of Proportional Relationships
4.1.1 How fast can I click?
4.1.2 How can I determine which grows faster?
4.1.3 How do I see the unit rate?
4.1.4 How can I write an equation?
4.1.5 What is the better deal?
4.1.6 What impact do I have?
4.1.7 How can I calculate values more efficiently?
4.1.8 How can I convert between different units of measurement?
4.1.9 How can I make the connections?
4.2 Circumference and Area of a Circle
4.2.1 How are they proportional?
4.2.2 How much space is inside?
4.2.3 What is the formula for the area of a circle?
4.2.4 How can the formula for the area of a circle help me?

Chapter 5

5.1 Probability
5.1.1 What are the chances?
5.1.2 How can I calculate the probability of more than one event?
5.1.3 What if there is more than one event?
5.1.4 What if there are more than two events?
5.1.5 How can I determine all of the outcomes?
5.1.6 What if it is more complicated?
5.2 Integer Operations Continued
5.2.1 How does each operation move points on a number line?
5.2.2 How can I show division?
5.2.3 How can I calculate it?
5.2.4 How can I check my guess?

Chapter 6

6.1 Data Distributions
6.1.1 Who is steadier?
6.1.2 How different are they?
6.1.3 How do they compare?
6.1.4 Who is more efficient?
6.1.5 How can I simulate a sample?
6.2 Numerical and Algebraic Expressions
6.2.1 How can I combine them?
6.2.2 How can I rewrite an expression?
6.2.3 How can I write an expression with negatives?
6.2.4 What does zero look like?
6.2.5 How does it move?
6.3 Equivalent Expressions
6.3.1 How can I group them?
6.3.2 Are they equivalent?
6.3.3 What are the connections?

Chapter 7

7.1 Operations With Rational Numbers
7.1.1 Will the amount increase or decrease?
7.1.2 Are differences and distance the same?
7.1.3 Can I add these?
7.2 Percent Change
7.2.1 Does this represent an increase or a decrease?
7.2.2 How does this change the total?
7.2.3 How is the money split?
7.2.4 Do I pay more?
7.3 Percents in the Real World
7.3.1 Is this good for business?
7.3.2 How much did it change?
7.3.3 Is this acceptable?
7.3.4 How are percents represented in expressions?
7.3.5 Which is easier, calculating with fractions or decimals?

Chapter 8

8.1 Multiplication and Division of Rational Numbers
8.1.1 Is the product positive or negative?
8.1.2 How are multiplication and division connected?
8.1.3 What is the relationship?
8.1.4 How can I divide?
8.1.5 How do I solve it?
8.2 Working With Expressions
8.2.1 Which is greater?
8.2.2 How can I record my work?
8.2.3 What happens when the comparison depends on x?

Chapter 9

9.1 Angle Relationships
9.1.1 How can I draw an angle?
9.1.2 How can I combine angles?
9.1.3 How can I calculate the measure of a missing angle?
9.2 Triangle Creation
9.2.1 How can I put angles and lengths together?
9.2.2 Will these lengths make a triangle?
9.2.3 How many triangles? 9.2.4 Can I construct it?
9.3 Volume and Surface Area
9.3.1 How much material do I need?
9.3.2 How do I calculate the surface area and volume?
9.3.3 How much will it hold?
9.3.4 What am I measuring?

Chapter 10

10.1: Explorations and Investigations
10.1.1 How can I make 0?
10.1.2 What number properties pair well?
10.1.3 How can you place algebraic expressions on the number line?
10.1.4 How can I solve it?
10.1.5 What can you say about the sums of consecutive numbers?
10.2: Restaurant Math
10.2.1 How can you draw it to scale?
10.2.2 How can you calculate the cost?
10.2.3 What do portions have to do with proportions?
10.2.4 What markdown undoes a markup?

Inspiring Connections
Course 2

Prelude

0.1.1

Who are my classmates?

0.1.2

How do I work collaboratively?

0.1.3

What questions can I ask?

0.1.4

How can I categorize my words?

0.1.5

How can I communicate my ideas?

0.1.6

How can the team build this together?

0.1.7

What do we need to work togethe


Chapter 1

1.1 Numbers and Data

1.1.1 How should data be placed on this line?

1.1.2 Where do these numbers belong on this line?

1.1.3 How can I use two lines to solve problems?

1.1.4 How can data be used to answer a question?

1.1.5 How are histograms helpful?

1.1.6 How else can data be displayed?

1.2 Shapes and Area,

1.2.1 How can I write equivalent expressions in area and perimeter?

1.2.2 What shapes make up the polygon?

1.2.3 How can I make it a rectangle?

1.3 Expressions

1.3.1 How can I describe it using symbols?

1.3.2 What are the parts of an expression?

1.3.3 How do I work with decimals?

1.3.4 How do I multiply multi-digit decimals?

1.3.5 How can I represent the arrangement?

Chapter 2

2.1 Ratio Language

2.1.1 How can I compare two quantities? 

2.1.2 How can I write ratios?

2.1.3 How can I see ratios in data representations?

2.2 Equivalent Ratios

2.2.1 How can I visualize ratios?

2.2.2 How can I see equivalent ratios in a table?

2.2.3 How can I see equivalent ratios in a double number line?

2.2.4 How can I see equivalent ratios in tape diagrams?

2.2.5  How can I use equivalent ratios?

2.2.6 What do these represent?

2.3 Measurement

2.3.1 What are the measurements?

2.3.2 What are the units?

2.3.3 How can I convert units

Chapter 3

3.1 Measures of Center 

3.1.1 How can I measure the center?

3.1.2 How else can I measure the center?

3.1.3 Which is the better measure of center?

3.1.4 What happens when I change the data?

3.2 Integers

3.2.1 What numbers do I see?

3.2.2 What number is this?

3.2.3 What does a number line say about a number?

3.2.4 How do I compare different types of numbers?

3.3 Absolute Value

3.3.1 How do I describe the location?

3.3.2 How far do I walk?

3.3.3 Which one is greater?

3.3.4 How do I communicate mathematically?


3.4 Coordinate Plane

3.4.1 How can you precisely indicate a location?

3.4.2 What is the correct order?

3.4.3bWhat symbol represents me?

Chapter 4

4.1 Fractions, Decimals, and Percents
4.1.1 How can I tell if the ratios are equal?
4.1.2 What does “percent” mean?
4.1.3 How can I convert a fraction?
4.1.4 How can I convert a percent?
4.1.5 How can I convert a decimal?

4.2 Percents 4.2.1 How can I show it?
4.2.2 What can I learn from the label?
4.2.3 Are the percents fair?
4.3 Unit Rates in Tables and Graphs 4.3.1 How can I compare rates?
4.3.2 Which rate is better?
4.3.3 Which deal is best?
4.3.4 What is the unit rate?
4.3.5 How can I use different data representations?

Chapter 5

5.1 Variation in Data
5.1.1 How do I ask a statistical question?
5.1.2 What does each representation say about the data?
5.1.3 What does the box in a box plot represent?
5.1.4 How else can I describe data?

5.2 Area
5.2.1 What is the height?
5.2.2 Can I reconfigure a parallelogram into a rectangle?
5.2.3 How do I calculate the area?
5.2.4 How many triangles do I need?
5.2.5 What is my perspective?
5.2.6 Is it fair to play by the rules?
5.2.7 What shapes do I see?

5.3 Fractions
5.3.1 How can I represent fraction multiplication?
5.3.2 How can I multiply fractions?
5.3.3 How can I multiply mixed numbers?

Chapter 6

6.1 Rules of Operations
6.1.1 What does it mean?
6.1.2 What do mathematicians call this?
6.1.3 How much should I ask for?
6.1.4 How can I write mathematical expressions?
6.1.5 How do mathematicians abbreviate?
6.1.6 In what order should I evaluate?

6.2 Multiples and Factors
6.2.1 When will they be the same?
6.2.2 What are multiples?
6.2.3 What do they have in common?
6.2.4 Who is your secret valentine?
6.2.5 How can I understand products?
6.2.6 How can I rewrite expressions?
6.2.7 Which method do I use?

Chapter 7

7.1 Whole Number and Decimal Division
7.1.1 How can I share equally?
7.1.2 Which strategy is the most efficient?
7.1.3 How can I write the number sentence?
7.1.4 How can I divide decimals?
7.1.5 How should the problem be arranged?

7.2 Fraction Division
7.2.1 What if the divisor is a fraction?
7.2.2 How many fit?
7.2.3 How can I visualize this?
7.2.4 What is common about this?
7.2.5 How can I use a Giant One?
7.2.6 Which method is most efficient?

Chapter 8

8.1. Algebra Tiles
8.1.1 What do these shapes represent?
8.1.2 What does a group of tiles represent?
8.1.3 What is an equivalent expression?
8.1.4 Which terms can be combined?
8.1.5 What do the numbers mean?
8.1.6 What can a variable represent?

8.2 Expressions
8.2.1 How can I count it?
8.2.2 What if the size of the pool is unknown?
8.2.3 How can I use an algebraic expression?

8.3 Equations and Inequalities
8.3.1 Which values make the equation true?
8.3.2 How can patterns be represented?
8.3.3 What is the equation?
8.3.4 How many could there be?

Chapter 9

9.1 Equations and Inequalities Continued
9.1.1 When is the statement true?
9.1.2 How do I undo that?
9.1.3 How can I visualize an equation?
9.1.4 How can I solve an equation?
9.1.5 How can I make the unknown known?
9.1.6 How can I include all the solutions?
9.1.7 Which method should I use?
9.2 Rate Problems
9.2.1 How much does rice cost?
9.2.2 How long will it take?
9.2.3 How can I compare them?
9.2.4 How long will the race take?
9.2.5 How can I represent the rate?

Chapter 10

10.1: Explorations and Investigations
10.1.1 How can I make 0?
10.1.2 What number properties pair well?
10.1.3 How can you place algebraic expressions on the number line?
10.1.4 How can I solve it?
10.1.5 What can you say about the sums of consecutive numbers?
10.2: Restaurant Math
10.2.1 How can you draw it to scale?
10.2.2 How can you calculate the cost?
10.2.3 What do portions have to do with proportions?
10.2.4 What markdown undoes a markup?

Chapter 11

11.1: Ratios and Proportions
11.1.1 How much food is there?
11.1.2 How much do we need?
11.1.3 How much is that?
11.1.4 How can I redesign the classroom?
11.2: The Number System
11.2.1 Can I determine all the right measurements?
11.2.2 How can I show my understanding?

Inspiring Connections
Course 3

Prelude

0.1.1 What can I learn from my classmates?
0.1.2 How can shapes move?
0.1.3 What does respect mean to me?
0.1.4 What story might this represent?
0.1.5 Do all cities value parks the same?
0.1.6 How can I contribute to my team?

Chapter 1

1.1 Data and Graphs
1.1.1 How can I represent data?
1.1.2 How can I use data to solve a problem?
1.1.3 Is the roller coaster safe?
1.1.4 Is there a relationship?
1.1.5 What is the relationship?

1.2 Introduction to Transformations
1.2.1 How can I move a figure on the coordinate plane?
1.2.2 How can I describe the steps precisely?
1.2.3 Is there another way?
1.3 Linear Relationships
1.3.1 How can I graph a proportional relationship?
1.3.2 How do they compare?
1.3.3 Can I graph myself?
1.3.4 How can I represent this with a graph?
1.3.5 How can I graph a linear relationship?

Chapter 2

2.1 Rigid Transformations
2.1.1 How can I describe it?
2.1.2 How does reflection affect coordinates?
2.1.3 What can I create?
2.2 Similarity
2.2.1 What if I multiply?
2.2.2 How do shapes change?
2.2.3 What can I say about dilated shapes?
2.2.4 Are they similar?
2.2.5 How can I move a shape on a coordinate plane?
2.3 Graphing Systems of Equations
2.3.1 Where do the lines cross?
2.3.2 Will different tile patterns ever have the same number of tiles?

Chapter 3

3.1 Trend Lines
3.1.1 Are these variables related?
3.1.2 Which line fits the data well?
3.1.3 How can this association be explained?
3.2 Solving Equations with Algebra Tiles
3.2.1 How can I represent an expression?
3.2.2 How can I rewrite an expression?
3.2.3 How can I compare two expressions?
3.2.4 How can I solve the equation?
3.3 Graphing Linear Equations
3.3.1 What is the rule?
3.3.2 How can I make a prediction?
3.3.3 What is a graph and how is it useful?
3.3.4 How should I graph?
3.3.5 What observations can I make about a graph?

Chapter 4

4.1 Exponents, Part 1
4.1.1 What is exponential growth?
4.1.2 How can you (re)write it?
4.1.3 How can notation help you make sense of exponential expressions?
4.1.4 Are there other exponent properties?
4.1.5 How can I prevent common exponential expression errors?
4.2 Solving Equations
4.2.1 How can I check my answer?
4.2.2 Is there always a solution?
4.2.3 How many solutions are there?
4.2.4 How can I solve complicated equations?
4.2.5 How can I write an equation to meet the criteria?
4.3 Exponents, Part 2
4.3.1 What if the exponent is not positive?
4.3.2 How do you know which exponent properties to use?

Chapter 5

5.1 Representations of a Line
5.1.1 What is the connection?
5.1.2 How can you show it?
5.1.3 How does it grow?
5.1.4 How is the growth represented?
5.1.5 How can I write the rule?
5.1.6 How can you make connections?
5.1.7 How can you use growth?
5.1.8 What are the connections?
5.2 Graphs & Equations of Systems
5.2.1 How can I change it to y = mx + b form?
5.2.2 How can I eliminate fractions and decimals in equations?
5.2.3 How do I change the line?
5.2.4 Is the intersection significant?
5.2.5 What is the equation?

Chapter 6

6.1 Solving Systems Algebraically
6.1.1 Where do the lines intersect?
6.1.2 When are they the same?
6.1.3 What if the equations are not in y = mx + b form?
6.1.4 How many solutions are there?
6.2 Slope & Rate of Change
6.2.1 What is the equation of the line?
6.2.2 How does y change with respect to x?
6.2.3 When is it the same?
6.2.4 What’s the point?
6.2.5 Can I connect rates to slopes?
6.3 Associations
6.3.1 What is the equation for a trend line?
6.3.2 How can I use an equation?
6.3.3 What if the data is not numerical?
6.3.4 Is there an association?

Chapter 7

7.1 Angles
7.1.1 How are the angles related?
7.1.2 Are there other congruent angles?
7.1.3 What about the angles in a triangle?
7.1.4 What if the angle is on the outside?
7.1.5 Can angles show similarity?
7.2 Right Triangle Theorem
7.2.1 Can I make a right triangle?
7.2.2 What is special about a right triangle?
7.2.3 How can I calculate the side length?
7.2.4 What kind of number is it?
7.2.5 How can I use the Right Triangle Theorem to Solve Problems?
7.2.6 How can I determine lengths in three dimensions?
7.2.7 How can I prove it?

Chapter 8

8.1Introduction to Functions


8.1.1

How can you (de)code the message?


8.1.2

How can a graph tell a story?


8.1.3

What can you predict?


8.1.4

Which prediction is best?


8.1.5

How does the output change based on the input?


8.1.6

How do you see the relationship?

8.2

 Characteristics of Functions


8.2.1

What is a function?


8.2.2

How can you describe the relationship?


8.2.3

How do I sketch it?


8.2.4

How many relationships are there?

8.3

Linear and Nonlinear Functions


8.3.1

Is it linear or nonlinear?


8.3.2

What clues do ordered pairs reveal about a relationship?


8.3.3

What other functions might you encounter?

Chapter 9

9.1Volume


9.1.1

Given the volume of a cube, how long is the side?


9.1.2

What if the base is not a polygon?


9.1.3

What if the layers are not the same?


9.1.4

What if it is oblique?


9.1.5

What if it is a three-dimensional circle?

9.2

Scientific Notation


9.2.1

How can I write very large or very small numbers?


9.2.2

How do I compare very large numbers?


9.2.3

How do I multiply and divide numbers written in scientific notation?


9.2.4

How do I add and subtract numbers written in scientific notation?


9.2.5

How do I compute it?

9.3

Applications of Volume


9.3.1

What does a volume function look like?


9.3.2

What is the biggest cone?


9.3.3

How do all the items fit together?

Chapter 10

10.1Explorations and Investigations


10.1.1

How close can I get?


10.1.2

Can you make them all?


10.1.3

How many triangles will there be?


10.1.4

What’s my angle?


10.1.5

Function-function, what’s your function?


10.1.6

Is it always true?


10.1.7

What’s right?


10.1.8

What’s your story?

You are now leaving cpmstg.wpengine.com.

Did you want to leave cpmstg.wpengine.com?

I want to leave cpmstg.wpengine.com.

No, I want to stay on cpmstg.wpengine.com

Algebra Tiles Blue Icon

Algebra Tiles Session

  • Used throughout CPM middle and high school courses
  • Concrete, geometric representation of algebraic concepts.
  • Two-hour virtual session,
  •  Learn how students build their conceptual understanding of simplifying algebraic expressions
  • Solving equations using these tools.  
  • Determining perimeter,
  • Combining like terms,
  • Comparing expressions,
  • Solving equations
  • Use an area model to multiply polynomials,
  • Factor quadratics and other polynomials, and
  • Complete the square.
  • Support the transition from a concrete (manipulative) representation to an abstract model of mathematics..

Foundations for Implementation

This professional learning is designed for teachers as they begin their implementation of CPM. This series contains multiple components and is grounded in multiple active experiences delivered over the first year. This learning experience will encourage teachers to adjust their instructional practices, expand their content knowledge, and challenge their beliefs about teaching and learning. Teachers and leaders will gain first-hand experience with CPM with emphasis on what they will be teaching. Throughout this series educators will experience the mathematics, consider instructional practices, and learn about the classroom environment necessary for a successful implementation of CPM curriculum resources.

Page 2 of the Professional Learning Progression (PDF) describes all of the components of this learning event and the additional support available. Teachers new to a course, but have previously attended Foundations for Implementation, can choose to engage in the course Content Modules in the Professional Learning Portal rather than attending the entire series of learning events again.

Edit Content

Building on Instructional Practice Series

The Building on Instructional Practice Series consists of three different events – Building on Discourse, Building on Assessment, Building on Equity – that are designed for teachers with a minimum of one year of experience teaching with CPM instructional materials and who have completed the Foundations for Implementation Series.

Building on Equity

In Building on Equity, participants will learn how to include equitable practices in their classroom and support traditionally underserved students in becoming leaders of their own learning. Essential questions include: How do I shift dependent learners into independent learners? How does my own math identity and cultural background impact my classroom? The focus of day one is equitable classroom culture. Participants will reflect on how their math identity and mindsets impact student learning. They will begin working on a plan for Chapter 1 that creates an equitable classroom culture. The focus of day two and three is implementing equitable tasks. Participants will develop their use of the 5 Practices for Orchestrating Meaningful Mathematical Discussions and curate strategies for supporting all students in becoming leaders of their own learning. Participants will use an equity lens to reflect on and revise their Chapter 1 lesson plans.

Building on Assessment

In Building on Assessment, participants will apply assessment research and develop methods to provide feedback to students and inform equitable assessment decisions. On day one, participants will align assessment practices with learning progressions and the principle of mastery over time as well as write assessment items. During day two, participants will develop rubrics, explore alternate types of assessment, and plan for implementation that supports student ownership. On the third day, participants will develop strategies to monitor progress and provide evidence of proficiency with identified mathematics content and practices. Participants will develop assessment action plans that will encourage continued collaboration within their learning community.

Building on Discourse

In Building on Discourse, participants will improve their ability to facilitate meaningful mathematical discourse. This learning experience will encourage participants to adjust their instructional practices in the areas of sharing math authority, developing independent learners, and the creation of equitable classroom environments. Participants will plan for student learning by using teaching practices such as posing purposeful questioning, supporting productive struggle, and facilitating meaningful mathematical discourse. In doing so, participants learn to support students collaboratively engaged with rich tasks with all elements of the Effective Mathematics Teaching Practices incorporated through intentional and reflective planning.