CPM Educational Program collaborates with grades 6–12 math teaching teams of any size to provide the student-centered education solution that classrooms need to promote student engagement and deep mathematical understanding. A nonprofit staffed with experienced teachers and built on over 35 years of experience, CPM guides educators as they support students’ problem solving, communication, collaboration, and sense making.
CPM envisions a world where mathematics is viewed as intriguing and useful, and is appreciated by all; where powerful mathematical thinking is an essential, universal, and desirable trait; and where people are empowered by mathematical problem solving and reasoning to solve the world’s problems.
CPM’s mission is to empower mathematics students and teachers through exemplary curriculum, professional development, and leadership. We recognize and foster teacher expertise and leadership in mathematics education. We engage all students in learning mathematics through problem solving, reasoning, and communication.
In a perfect world, every student would have the opportunity to learn math by being engaged and challenged. We are working to make this possible: More math for more students! CPM does not aspire to be the biggest publisher, but we do believe we are among the few who truly put student learning first.
CPM began when a few university professors were awarded two Eisenhower grants. These professors came together with 30 math teachers around Sacramento, California in a grassroots effort to change the way mathematics courses were taught.
Read more below.
As a response to the wide range of curricula that claim to be research based, in 2007, Dr. Clements articulated a framework that outlines phases for the development of research-based curricula (Clements, 2007, Sarama & Clements, 2019). This framework was peer-reviewed and published in NCTM’s prestigious Journal for Research in Mathematics Education. In 2019, Sarama & Clements extended this line of research, arguing:
We need scientific approaches to the conceptualization, design, creation, implementation, and scale-up of curricula that are not just “based on” or “validated by” research but that were constructed, refined, and evaluated with a comprehensive program of research and development…
A curriculum development program should address not only the practical question of whether the curriculum is effective in helping children achieve specific learning goals, but also the conditions under which it is effective. Theoretically, the research program should also address why it is effective and why certain sets of conditions decrease or increase the curriculum’s effectiveness.
A core feature of the [Curriculum Research Framework] is that it is grounded in coordinated interdisciplinary research … to scale-up [across 10 phases]… Each phase must yield positive results to proceed to the next. (pp. 144-145)
While CPM predates this Curriculum Research Framework, it also aligns with many (but not all) of the phases described within the framework. CPM continues to pursue research from multiple domains such as cognitive science, psychology, mathematics education, and the learning sciences to inform curriculum and professional learning design, evaluate the effectiveness of the program under particular conditions at both local and large-scales, and contribute to the field’s understanding of how to best support mathematics teaching and learning at the 6-12 levels.
CPM was born with two Eisenhower grants between 1989 and 1995 when a group of 30 math teachers in and around Sacramento, CA came together in a grassroots effort to change the way mathematics courses were taught. Within 2 years of the first grant, more than 500 teachers were using CPM materials, and within 3 years well more than 1,000 teachers were supported by CPM materials and professional development. By the end of the decade, CPM was a core curriculum in more than 20% of California schools. More importantly, teachers reported that after taking CPM’s Algebra 1 course, students no longer asked “What am I ever going to use this for?” — an indicator of meaningful mathematical experiences.
The original title of the program, established with the first Eisenhower Grant, College Preparatory Mathematics: Change from Within, reflected the growing requirement of algebra around the country as a high school graduation requirement. Change from Within reflected the grassroots of CPM’s design as by teachers, for teachers. The second Eisenhower Grant, College Preparatory Mathematics: Change through Assessment, aimed to support teacher learning around assessment; primarily, that teaching math differently requires assessing differently. The name College Preparatory Mathematics served to reassure teachers and parents that the courses were substantive treatments of these traditional courses and were aligned to state standards. This was especially important as the national “math wars,” especially in California, raged over how to teach K-12 mathematics.
Then, as with today, many mathematics classes — but particularly Algebra 1 — were functioning as a filter, holding many students back from attending college. These teachers took action within their own classrooms to reverse this inequity.
Guided by three founders — two university professors, Drs. Tom Sallee and Elaine Kasimatis, and the then director of the Northern California Math Project and current professor of mathematics education, Judy Kysh — the goal of the group was to make Algebra courses a pump rather than a filter, opening opportunities for more students to attend college. The professors and teachers worked together: Teachers deferred to professors for issues of mathematics; Professors deferred to teachers for issues of pedagogy. Together, the professors and teachers wrote courses and provided professional learning workshops that gradually shifted how mathematics was taught.
During the 1988-89 school year, the group met to discuss the California Mathematics Framework, a precursor to the 1989 NCTM standards. They also discussed research on both constructivism and learning through teamwork. These discussions helped the group understand how students could best learn mathematics. Based on these discussions of research and years of classroom experience, the group distilled what are now known as The Three Pillars of CPM: Collaborative Learning, Problem-Based Learning, and Mixed Spaced Practice
This process of examining existing research encompasses Phases 1–4 of Clements’ framework: CPM is rooted in an analysis of what was known about the relationship between the mathematics content, student thinking, and pedagogy (Phases 1-3). For Phase 4, Clements (2007) suggests that the flow of content in curricula be constructed based on models of students’ thinking and learning generated in formal academic research. Such models of student thinking, often called “learning trajectories,”1 began to emerge in the mid 1990s (Simon, 1995 PDF) Indeed, studies of learning in classrooms rather than in clinical or laboratory settings were just emerging at the time of CPM’s origin, a time when constructivist theories of learning were being newly explored. According to Simon:
“Although constructivism provides a useful basis for thinking about mathematics learning in classrooms, it does not tell us how to teach mathematics. … [Learning trajectories research] contributes to a dialogue on what teaching might be like if it is built on a constructivist perspective on knowledge development. The specific focus of [learning trajectories research in mathematics education] is on decision making with respect to mathematics content and mathematical tasks for classroom learning” (1995, p. 4).
In this way, although CPM’s first materials predate this research, materials were based on models of student thinking generated by the pioneering group of CPM teacher-authors and founders. Discussions between teacher-authors, their colleagues, and founder Judy Kysh about how students responded to the materials and how teachers used the materials led to the iterative refinement of the textbooks’ embedded hypothesized learning trajectories.
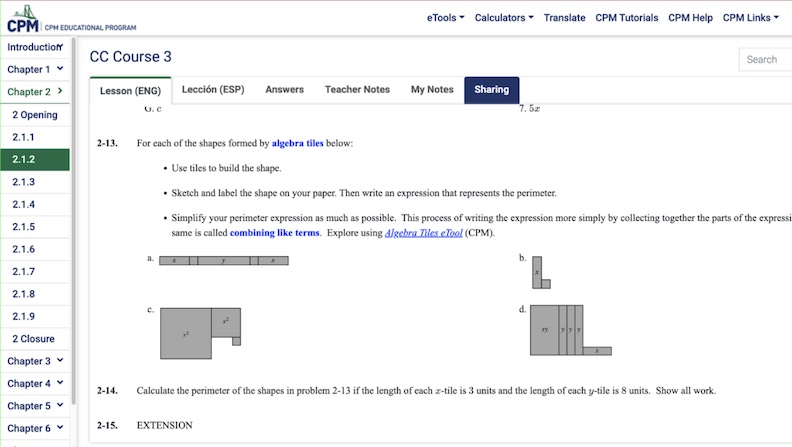
To design curricula that spurred student interest, engagement, and learning, the flow of content in CPM’s curricula is grounded in CPM teacher-authors’ experience (collectively, hundreds of years of experience) thinking about students’ mathematical thinking. Even more, the models of students’ mathematical thinking that informed the design of the curriculum were also informed by research. In this way, CPM is based on trustworthy models of students’ thinking that characterize how students progressively construct and refine their understandings of mathematical concepts. The mathematical trajectory of CPM curricula is not arbitrary, but is purposefully designed to support both deep, conceptual mathematics learning and procedural fluency. Described below are three takeaways from research that deeply informed the original development of CPM: Learners construct rather than acquire understandings, Learning is supported by starting with the big picture, and Narrative and mathematical storylines support aesthetic responses.
Research takeaway: Learners construct rather than acquire understandings
The founders and teachers leveraged brain-based research from the 80’s and 90’s on how people think. Some members of the original CPM group attended lectures by Marian Diamond of the Lawrence Hall of Science, and other scholars such as Marny Sorgen (author and former teaching colleague of CPM founder Judy Kysh) gave regular presentations to the group. Constance Kamii’s research on intellectual autonomy was also influential in the original design of CPM. Kamii developed Number Talks, and was one of the first scholars to describe children’s cognition around addition and subtraction, particularly how children construct their own understandings regardless of how they are taught. In this way, CPM’s design helps teachers build on students’ logical thinking to help them construct understandings of canonical mathematical concepts.
Research takeaway: Learning is supported by starting with the big picture
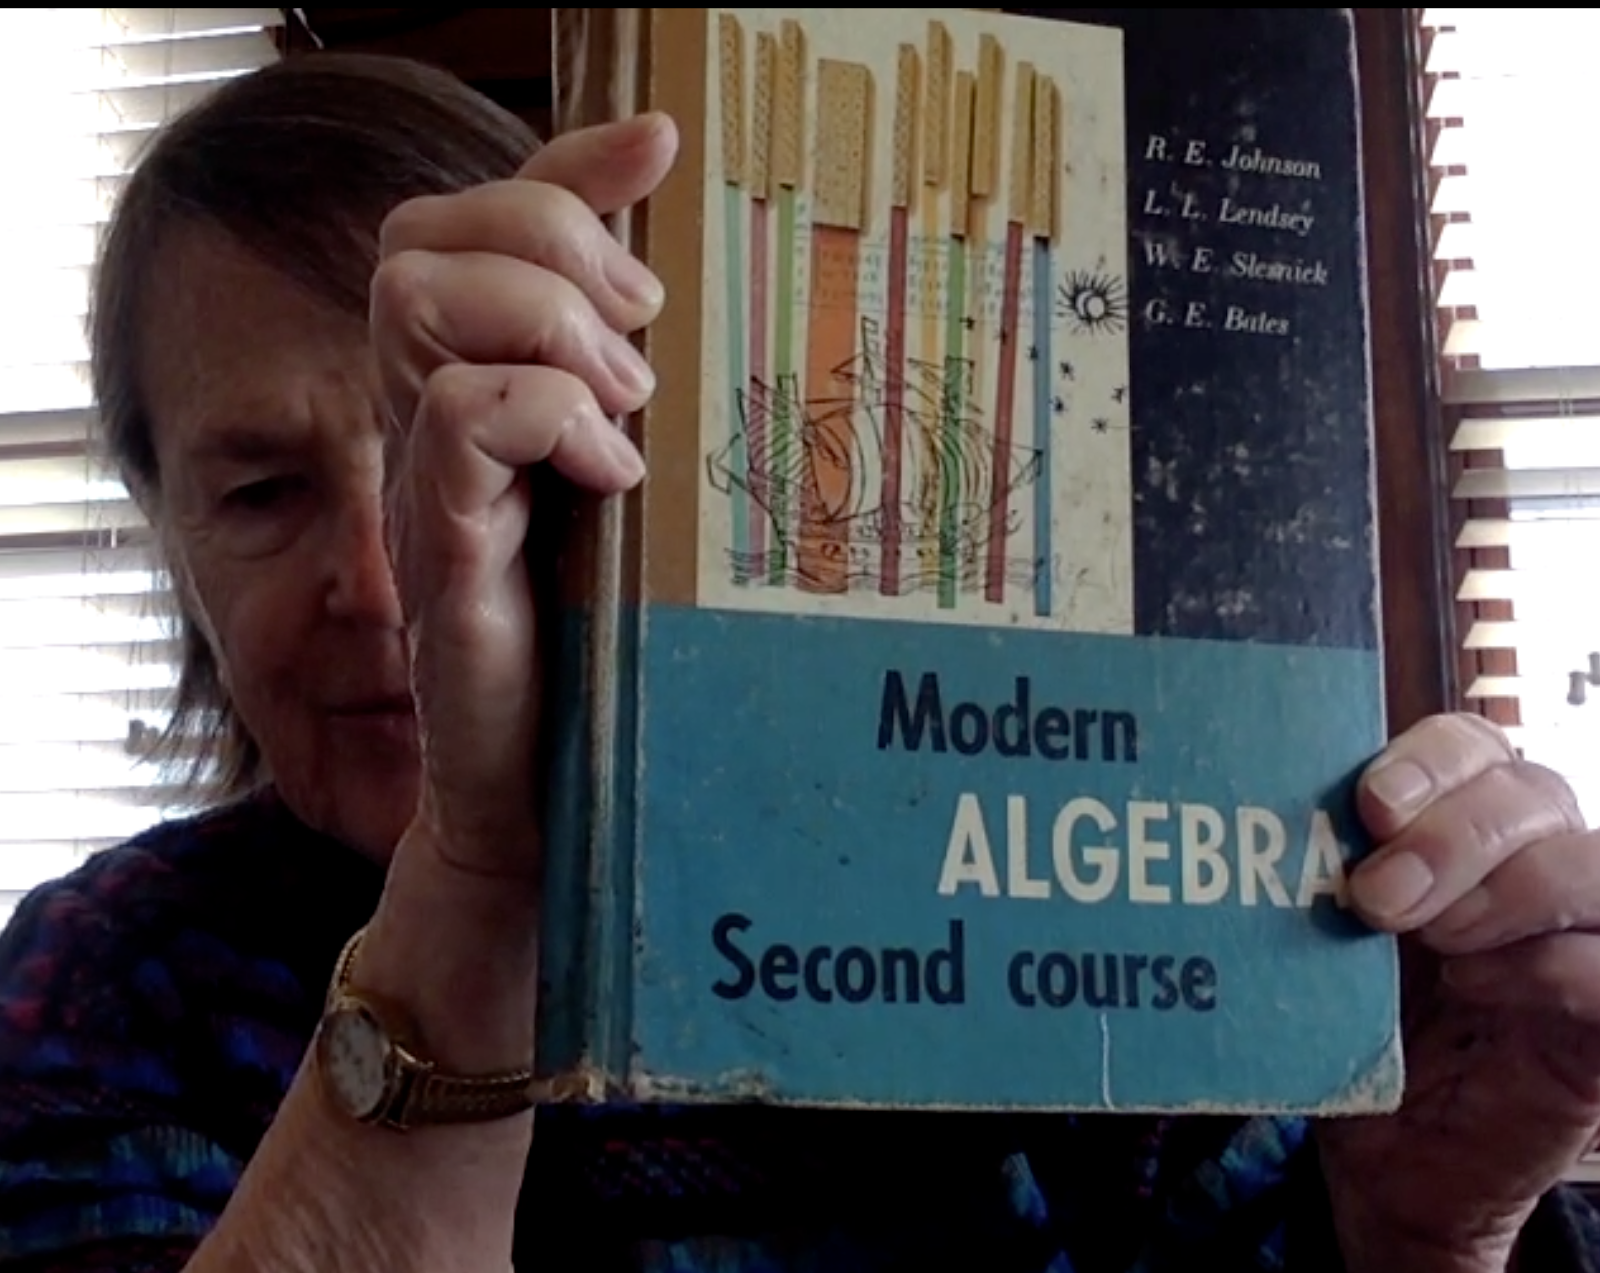
From reading, attending conferences, and soliciting researchers to give presentations on their findings, the group formed another key takeaway: Students learn mathematics best when they start with a big picture that has some sort of mystery to be uncovered. Beyond being supported by research, the veracity of this principle of learning was experienced first hand by some of the original group. For example, founder Judy Kysh cites an Algebra textbook written by Johnson, Lendsey, Sleznick, and Bates (an Addison Wesley book) as having deeply influenced her thinking. Unlike most texts of the day that had problems that could not be successfully completed without first examining pre-worked examples, in this text, learners could solve new problems by reasoning about what they had done in prior problems. A lot of problems in CPM’s original text were inspired by the Johnson and colleagues textbook, pictured right. They were also inspired founder Judy Kysh’s (then Judy Salem) work on a Scott Foresman (a bygone publisher) Algebra 1 and Algebra 2 textbook series (copyright 1984) in which each chapter began with a real problem, and by the end of the chapter enough math had been developed to solve the opening problem. Following this inspiration, CPM chapters were originally named for their real-world big problems, rather than for the mathematics in them. Anecdotal evidence from student portfolios and interviews suggested students remembered the mathematics by the problem that they encountered it in, and this helped them solve similar problems in other contexts.
Research takeaway: Narrative and mathematical storylines support aesthetic responses
Over the years, building on more recent research, CPM materials have developed to not only use big problems, but even more, to develop both narrative and mathematical storylines (e.g., Dietiker, 2013, 2016, 2019). CPM’s textbooks are designed such that the mathematics storyline and the narrative storyline go hand in hand, one does not serve the other. In CPM texts, students encounter situations with an enigma— something that students will not yet know how to resolve. The mathematics in the texts was and is organized so that students experience ah-ha moments— so that students experience aesthetic dimensions of mathematics, such as feelings of curiosity and surprise as they construct mathematical connections and elegant solutions.
From the peer-reviewed academic research described above, CPM synthesized three design principles that have since become known as The Three Pillars of CPM: Collaborative Learning, Problem-Based Learning, and Mixed Spaced Practice. Grounding the curriculum in these three pillars, the group wrote a new set of Algebra 1 material (aka Math 1) in five weeks in the summer of 1989, with an additional smaller team editing and polishing. Then, during the 1989-90 school year, the teachers who worked on the materials piloted them and took notes on how to improve them. They met nearly every month of the year to share and create a collective record of their experiences teaching with the materials. After this pilot, the teachers revised the Algebra 1 materials and created the first Geometry text (aka Math 2) in the summer of 1990, then piloted the Algebra 1 materials for a second time and the Geometry materials for the first time in the 1990-91 school year. An Algebra 2 text (aka Math 3) was written a few years later, beginning in the summer of 1992, then undergoing two rounds of field-testing and review, and settling on the final first edition in the summer of 1994.
Back in those days, the text materials were distributed by chapter as shrink-wrapped stacks of loose leaf pages from the back of a van that founder Judy Kysh drove to a central location. Teachers drove there to get their pages, engaged in professional development together for the entire day, and then took the materials back to their schools for copying. Most teachers distributed a unit or chapter at a time.
In 1993 when the quantity of materials began to exceed the capacity of Judy’s van (borrowed from a university), CPM incorporated as a California nonprofit corporation so that soft-bound versions of Algebra and Geometry could be printed and sold. Teachers no longer had to copy and distribute materials at their schools.
CPM incorporated as “CPM Educational Program,” not “College Preparatory Mathematics.” CPM incorporated as CPM Educational Program instead of College Preparatory Mathematics because it was commonly known as CPM. In addition, feedback from teachers revealed that all students—not only college bound students—benefited from learning with CPM materials. Consequently, the courses and teacher professional learning opportunities were, from then on, known simply as CPM.
Many of CPM’s transformational professional learning experiences—such as the Academy of Best Practices and the Teacher Researcher Corps—are made possible by funds from textbooks.
From its inception, CPM was grounded in research, designed in the spirit of the standards, and was known by those who adopted it to support rigorous mathematics learning for both career- and college-bound students. Yet, for years, there was no official summary of research that supported the curricula’s design. After much anticipation, in 2013, one of the founders, Dr. Tom Sallee, formalized the CPM Research Base by conducting a literature review around CPMs Three Pillars. This 2013 CPM Research Base Report does not encompass all of the a priori research done by the three founders and the 30 teachers who created the curriculum, but it does encompass evidence that CPM’s Three Pillars support mathematics learning.
The soundness of CPM’s research-based design has been affirmed in external reviews. In 1999, the US Department of Education selected CPM as one of the top twelve reform-based mathematics curricula (source). Five mandatory criteria were used to evaluate the texts: engage students in mathematical inquiry, focus on mathematical content, be appropriate for high school students, use information technology for inquiry teaching and learning, and be supported by research.
CPM continues to be recognized as an exemplary curriculum. In 2013-2014, the California State Board of Education (CA BOE, 2013-2014) reviewed CPM with its curriculum alignment tool, which is similar to the Instructional Materials Evaluation Tool — a rigorous Common Core-aligned curriculum evaluation tool2 developed by one of the principal authors of the CCSSM standards (Jason Zimba, Achievethecore.org). The review investigated CPM’s middle grades courses and Core Connections Algebra for (1) mathematical alignment with the standards, (2) program organization, (3) assessment, (4) universal access, (5) instructional planning, and (6) teacher support. This review resulted in CA’s adoption of CPM for grades 6-8 and Algebra, which then led many local school districts to conduct independent reviews using their own criteria. Some of these reviews expanded beyond the materials reviewed by the CA BOE, including Geometry, Algebra 2, and Integrated I, II, and III.
Finally, CPM’s middle school series (Core Connections 1-3) and both high school pathways (Traditional and Integrated) have been reviewed by EdReports. Both high school pathways received the highest rating of meets expectations. The Core Connections middle school series received good reviews.3 According to EdReports,
“The [Traditional and Integrated high school] materials attend to the full intent of the mathematical content standards and also attend fully to the modeling process when applied to the modeling standards. The materials also meet the expectations for rigor and the Mathematical Practices as they reflect the balances in the Standards and help students meet the Standards’ rigorous expectations and meaningfully connect the Standards for Mathematical Content and the Standards for Mathematical Practice.” (Source for Integrated and Traditional high school series, see more Independent Reviews from EdReports and others as linked on CPM’s website.)
Due to CPM’s performance on independent reviews and strong reputation for supporting standards-based instruction, CPM was solicited by scholars at universities across the US to collaborate on the 2020 Gates Foundation Grand Challenge for Algebra 1, Balancing the Equation.
Today, CPM’s diversely qualified team is still guided by some of the original teachers who helped research, write, field-test, and revise the first versions of the curriculum. Holding true to its roots, CPM values and supports teachers as curriculum writers, teacher-researchers (TRC), and professional learning leaders (RPLCs) — and also has a research department that supports these efforts. Currently, CPM is looking into implementation and impact studies that account for its programmatic theory as another way to buttress its research base, although these may be delayed by COVID-19.
These future studies will meet the last six phases of the framework for research-based curricula. The last five phases include investigating the curriculum’s effectiveness with various student groups and teachers and investigating how it can be improved to serve diverse situations and needs.
CPM also funds non-evaluative external research as part of its CPM Research Grants Program, which aims to support research that contributes to the broad mathematics education community. Research from this program has contributed to both theory and practice in mathematics education, thus contributing to meeting two of the three emphases of the framework — theory, practice, and policy.
While materials are no longer distributed out of the back of a van, CPM’s dedication to translating research into practice, and commitment to the founding pillars of Collaboration, Problem-Based Learning, and Mixed Spaced Practice are still at the heart of CPM. With each new edition and series, CPM draws on available research to determine how to best support teachers to be successful in helping all students learn mathematics deeply, usefully, and permanently.
CPM originated in conjunction with two Eisenhower Grants and the Math Project.
Learn about how our research base started, our results, and efforts to support more educators!
CPM has its first Summer Leadership Institute.
Participate in our engaging and teacher-led initiatives!
CPM Professional Learning is officially accredited by the Middle States Association Commission on Elementary and Secondary Schools (MSA-CESS).
Learn more about our accreditation process and how you can earn continuing education credits through us!
The Inspiring Connections middle school courses are standards-based and organized around engaging, team-worthy, non-routine problems.
Learn more about this new middle school curriculum.
Section 6.1
6.1.1 Rigid Transformations
6.1.2 Rigid Transformations on a Coordinate Graph
6.1.3 Describing Transformations
6.1.4 Using Rigid Transformations
Section 6.2
6.2.1 Multiplication and Dilation
6.2.2 Dilations and Similar Figures
6.2.3 Identifying Similar Shapes
6.2.4 Similar Figures and Transformations
6.2.5 Working With Corresponding Sides
6.2.6 Solving Problems Involving Similar Shapes
Chapter Closure
Section 7.1
7.1.1 Circle Graphs
7.1.2 Organizing Data in a Scatterplot
7.1.3 Identifying and Describing Association
Section 7.2
7.2.1 y = mx + b Revisited
7.2.2 Slope
7.2.3 Slope in Different Representations
7.2.4 More About Slope
7.2.5 Proportional Equations
Section 7.3
7.3.1 Using Equations to Make Predictions
7.3.2 Describing Association Fully
7.3.3 Association Between Categorical Variables
Chapter Closure
Section 8.1
8.1.1 Patterns of Growth in Tables and Graphs
8.1.2 Compound Interest
8.1.3 Linear and Exponential Growth
Section 8.2
8.2.1 Exponents and Scientific Notation
8.2.2 Exponent Rules
8.2.3 Negative Exponents
8.2.4 Operations with Scientific Notation
Section 8.3
8.3.1 Functions in Graphs and Tables
Chapter Closure
Section 9.1
9.1.1 Parallel Line Angle Pair Relationships
9.1.2 Finding Unknown Angles in Triangles
9.1.3 Exterior Angles in Triangles
9.1.4 AA Triangle Similarity
Section 9.2
9.2.1 Side Lengths and Triangles
9.2.2 Pythagorean Theorem
9.2.3 Understanding Square Root
9.2.4 Real Numbers
9.2.5 Applications of the Pythagorean Theorem
9.2.6 Pythagorean Theorem in Three Dimensions
9.2.7 Pythagorean Theorem Proofs
Chapter Closure
Section 10.1
10.1.1 Cube Roots
10.1.2 Surface Area and Volume of a Cylinder
10.1.3 Volumes of Cones and Pyramids
10.1.4 Volume of a Sphere
10.1.5 Applications of Volume
Chapter Closure
10.2.1 Indirect Measurement
10.2.2 Finding Unknowns
10.2.3 Analyzing Data to Identify a Trend
1. Operations with Signed Fractions and Decimals
2. Evaluating Expressions and Using Order of Operations
3. Unit Rates and Proportions
4. Area and Perimeter of Circles and Composite Figures
5. Solving Equations
6. Multiple Representations of Linear Equations
7. Solving Equations with Fractions and Decimals (Fraction Busters)
8. Transformations
9. Scatterplots and Association
Section 12.1
12.1.1 Sampling Distribution of the Slope of the Regression Line
12.1.2 Inference for the Slope of the Regression Line
Section 12.2
12.2.1 Transforming Data to Achieve Linearity
12.2.2 Using Logarithms to Achieve Linearity
Section 13.1
13.1.1 Modeling With the Chi-Squared Distribution
13.1.2 Introducing the F-Distribution
Section 13.2
13.2.1 One-Way ANOVA
Section 13.3
13.3.1 Sign Test: Introduction to Nonparametric Inference
13.3.2 Mood’s Median Test
Section 6.1
6.1.1 Comparing Expressions
6.1.2 Comparing Quantities with Variables
6.1.3 One Variable Inequalities
6.1.4 Solving One Variable Inequalities
Section 6.2
6.2.1 Solving Equations
6.2.2 Checking Solutions and the Distributive Property
6.2.3 Solving Equations and Recording Work
6.2.4 Using a Table to Write Equations from Word Problems
6.2.5 Writing and Solving Equations
6.2.6 Cases with Infinite or No Solutions
6.2.7 Choosing a Solving Strategy
Chapter Closure
Section 7.1
7.1.1 Distance, Rate, and Time
7.1.2 Scaling Quantities
7.1.3 Solving Problems Involving Percents
7.1.4 Equations with Fraction and Decimal Coefficients
7.1.5 Creating Integer Coefficients
7.1.6 Creating Integer Coefficients Efficiently
7.1.7 Percent Increase and Decrease
7.1.8 Simple Interest
Section 7.2
7.2.1 Finding Missing Information in Proportional Relationships
7.2.2 Solving Proportions
Chapter Closure
Section 8.1
8.1.1 Measurement Precision
8.1.2 Comparing Distributions
Section 8.2
8.2.1 Representative Samples
8.2.2 Inference from Random Samples
Section 8.3
8.3.1 Introduction to Angles
8.3.2 Classifying Angles
8.3.3 Constructing Shapes
8.3.4 Building Triangles
Chapter Closure
Section 9.1
9.1.1 Circumference, Diameter, and Pi
9.1.2 Area of Circles
9.1.3 Area of Composite Shapes
Section 9.2
9.2.1 Surface Area and Volume
9.2.2 Cross Sections
9.2.3 Volume of a Prism
9.2.4 Volume of Non-Rectangular Prisms
Chapter Closure
Section 9.3
9.3.1 Volume and Scaling
9.3.2 Using Multiple Math Ideas to Create an Interior Design
9.3.3 Applying Ratios
Checkpoint 1: Area and Perimeter of Polygons
Checkpoint 2: Multiple Representations of Portions
Checkpoint 3: Multiplying Fractions and Decimals
Checkpoint 5: Order of Operations
Checkpoint 6: Writing and Evaluating Algebraic Expressions
Checkpoint 7A: Simplifying Expressions
Checkpoint 7B: Displays of Data: Histograms and Box Plots
Checkpoint 8: Solving Multi-Step Equations
Checkpoint 9: Unit Rates and Proportions
Section 11.1
11.1.1 Area Bounded by a Polar Curve
11.1.2 More Polar Area
11.1.3 Area Between Polar Curves
Section 11.2
11.2.1 Applied Calculus in Component Form
11.2.2 Second Derivatives in Component Form
11.2.3 Total Distance and Arc Length
Section 11.3
11.3.1 Slopes of Polar Curves
11.3.2 More Slopes of Polar Curves
Section 11.4
11.4.1 Battling Robots
Section 12.1
12.1.1 Approximating with Polynomial Functions
12.1.2 Taylor Polynomials About x = 0
12.1.3 Taylor Polynomials About x = c
12.1.4 Taylor Series
12.1.5 Building Taylor Series Using Substitution
Section 12.2
12.2.1 Interval of Convergence Using Technology
12.2.2 Interval of Convergence Analytically
Section 12.3
12.3.1 Error Bound for Alternating Taylor Polynomials
12.3.2 Lagrange Error Bound
Section 12.4
12.4.1 Evaluating Indeterminate Forms Using Taylor Series
Opening | 1.OP | Chapter Opening |
---|---|---|
Section 1.1 | 1.1.1 | Visualizing Information |
1.1.2 | Perimeter and Area Relationships | |
1.1.3 | Describing and Extending Patterns | |
1.1.4 | Representing Data | |
1.1.5 | Making Sense of a Logic Problem | |
Section 1.2 | 1.2.1 | Multiple Representations |
1.2.2 | Representing Comparisons | |
1.2.3 | Characteristics of Numbers | |
1.2.4 | Products, Factors, and Factor Pairs | |
Section 1.3 | 1.3.1 | Attributes and Characteristics of Shapes |
1.3.2 | More Characteristics of Shapes | |
Closure | 1.CL | Chapter Closure |
Opening | 2.OP | Chapter Opening |
---|---|---|
Section 2.1 | 2.1.1 | Dot Plots and Bar Graphs |
2.1.2 | Histograms and Stem-and-Leaf Plots | |
Section 2.2 | 2.2.1 | Exploring Area |
2.2.2 | Square Units and Area of Rectangles | |
2.2.3 | Area and Perimeter | |
Section 2.3 | 2.3.1 | Using Rectangles to Multiply |
2.3.2 | Using Generic Rectangles | |
2.3.3 | Distributive Property | |
2.3.4 | Generic Rectangles and the Greatest Common Factor | |
Closure | 2.CL | Chapter Closure |
Opening | 3.OP | Chapter Opening |
---|---|---|
Section 3.1 | 3.1.1 | Using the Multiplicative Identity |
3.1.2 | Portions as Percents | |
3.1.3 | Connecting Percents with Decimals and Fractions | |
3.1.4 | Multiple Representations of a Portion | |
3.1.5 | Completing the Web | |
3.1.6 | Investigating Ratios | |
Section 3.2 | 3.2.1 | Addition, Subtraction, and Opposites |
3.2.2 | Locating Negative Numbers | |
3.2.3 | Absolute Value | |
3.2.4 | Length on a Coordinate Graph | |
Closure | 3.CL | Chapter Closure |
Opening | 4.OP | Chapter Opening |
---|---|---|
Section 4.1 | 4.1.1 | Introduction to Variables |
4.1.2 | Writing Equivalent Expressions | |
4.1.3 | Using Variables to Generalize | |
Section 4.2 | 4.2.1 | Enlarging Two-Dimensional Shapes |
4.2.2 | Enlarging and Reducing Figures | |
4.2.3 | Enlargement and Reduction Ratios | |
4.2.4 | Ratios in Other Situations | |
Closure | 4.CL | Chapter Closure |
Opening | 5.OP | Chapter Opening |
---|---|---|
Section 5.1 | 5.1.1 | Representing Fraction Multiplication |
5.1.2 | Describing Parts of Parts | |
5.1.3 | Calculating Parts of Parts | |
5.1.4 | Multiplying Mixed Numbers | |
Section 5.2 | 5.2.1 | Making Sense of Decimal Multiplication |
5.2.2 | Fraction Multiplication Number Sense | |
Section 5.3 | 5.3.1 | Rearranging Areas |
5.3.2 | Area of a Parallelogram | |
5.3.3 | Area of a Triangle | |
5.3.4 | Area of a Trapezoid | |
Closure | 5.CL | Chapter Closure |
Section 5.4 | Mid-Course Reflection Activities |
Opening | 6.OP | Chapter Opening |
---|---|---|
Section 6.1 | 6.1.1 | Dividing |
6.1.2 | Fractions as Division Problems | |
6.1.3 | Problem Solving with Division | |
6.1.4 | Solving Problems Involving Fraction Division | |
Section 6.2 | 6.2.1 | Order of Operations |
6.2.2 | Area of a Rectangular Shape | |
6.2.3 | Naming Perimeters of Algebra Tiles | |
6.2.4 | Combining Like Terms | |
6.2.5 | Evaluating Algebraic Expressions | |
Closure | 6.CL | Chapter Closure |
Opening | 7.OP | Chapter Opening |
---|---|---|
Section 7.1 | 7.1.1 | Comparing Rates |
7.1.2 | Comparing Rates with Tables and Graphs | |
7.1.3 | Unit Rates | |
Section 7.2 | 7.2.1 | Analyzing Strategies for Dividing Fractions |
7.2.2 | Another Strategy for Division | |
7.2.3 | Division with Fractions and Decimals | |
7.2.4 | Fraction Division as Ratios | |
Section 7.3 | 7.3.1 | Inverse Operations |
7.3.2 | Distributive Property | |
7.3.3 | Distributive Property and Expressions Vocabulary | |
7.3.4 | Writing Algebraic Equations and Inequalities | |
Closure | 7.CL | Chapter Closure |
Opening | 8.OP | Chapter Opening |
---|---|---|
Section 8.1 | 8.1.1 | Measures of Central Tendency |
8.1.2 | Choosing Mean or Median | |
8.1.3 | Shape and Spread | |
8.1.4 | Box Plots and Interquartile Range | |
8.1.5 | Comparing and Choosing Representations | |
Section 8.2 | 8.2.1 | Statistical Questions |
Section 8.3 | 8.3.1 | Writing Multiplication Equations |
8.3.2 | Distance, Rate, and Time | |
8.3.3 | Unit Conversion | |
Closure | 8.CL | Chapter Closure |
Opening | 9.OP | Chapter Opening |
---|---|---|
Section 9.1 | 9.1.1 | Volume of a Rectangular Prism |
9.1.2 | Nets and Surface Area | |
Section 9.2 | 9.2.1 | Multiplicative Growth and Percents |
9.2.2 | Composition and Decomposition of Percents | |
9.2.3 | Percent Discounts | |
9.2.4 | Simple Interest and Tips | |
Closure | 9.CL | Chapter Closure |
Section 9.3 | 9.3.1 | A Culminating Portions Challenge |
9.3.2 | Representing and Predicting Patterns | |
9.3.3 | Analyzing Data to Identify a Trend |
CP 1: Using Place Value to Round and Compare Decimals
CP 2: Addition and Subtraction of Decimals
CP 3: Addition and Subtraction of Fractions
CP 4: Addition and Subtraction of Mixed Numbers
CP 5: Multiple Representations of Portions
P 6: Locating Points on a Number Line and on a Coordinate Graph
CP 7A: Multiplication of Fractions and Decimals
CP 7B: Area and Perimeter of Quadrilaterals and Triangles
CP 8A: Rewriting and Evaluating Variable Expressions
CP 8B: Division of Fractions and Decimals
CP 9A: Displays of Data: Histograms and Box Plots
CP 9B: Solving One-Step Equations
Section 11.1
11.1.1 Plotting Polar Coordinates
11.1.2 Graphs of Polar Functions
11.1.3 Families of Polar Functions
11.1.4 Converting Between Polar and Rectangular Forms
Section 11.2
11.2.1 Using the Complex Plane
11.2.2 Operations with Complex Numbers Geometrically
11.2.3 Polar Form of Complex Numbers
11.2.4 Operations with Complex Numbers in Polar Form
11.2.5 Powers and Roots of Complex Numbers
Closure
Section 12.1
12.1.1 Arithmetic Series
12.1.2 Geometric Series
12.1.3 Infinite Geometric Series 12.1.4 Applications of Geometric Series
12.1.5 The Sum of the Harmonic Series
Section 12.2
12.2.1 The Binomial Theorem
12.2.2 Binomial Probabilities
Section 12.3
12.3.1 Expected Value of a Discrete Random Variable
12.3.2 Expected Value and Decision Making
Closure
Section 13.1
13.1.1 A Race to Infinity
13.1.2 Limits to Infinity
13.1.3 Evaluating Limits at a Point Algebraically
13.1.4 Another Look at e
Section 13.2
13.2.1 Trapping Area With Trapezoids
13.2.2 Area as a Function
13.2.2A Going all to Pieces: Writing an Area Program
13.2.3 Rocket Launch
Section 13.3
13.3.1 Velocity and Position Graphs
13.3.2 Instantaneous Velocity
13.3.3 Slope Functions
13.3.4 The Definition of Derivative
13.3.5 Slope and Area Under a Curve
Closure
2.3.4
Defining Concavity
4.4.1
Characteristics of Polynomial Functions
5.2.6
Semi-Log Plots
5 Closure
Closure How Can I Apply It? Activity 3
9.3.1
Transition States
9.3.2
Future and Past States
10.3.1
The Parametrization of Functions, Conics, and Their Inverses
10.3.2
Vector-Valued Functions
11.1.5
Rate of Change of Polar Functions
Section 6.1
6.1.1 Comparing Expressions
6.1.2 Comparing Quantities with Variables
6.1.3 One Variable Inequalities
6.1.4 Solving One Variable Inequalities
Section 6.2
6.2.1 Solving Equations
6.2.2 Checking Solutions and the Distributive Property
6.2.3 Solving Equations and Recording Work
6.2.4 Using a Table to Write Equations from Word Problems
6.2.5 Writing and Solving Equations
6.2.6 Cases with Infinite or No Solutions
6.2.7 Choosing a Solving Strategy
Chapter Closure
Section 7.1
7.1.1 Distance, Rate, and Time
7.1.2 Scaling Quantities
7.1.3 Solving Problems Involving Percents
7.1.4 Equations with Fraction and Decimal Coefficients
7.1.5 Creating Integer Coefficients
7.1.6 Creating Integer Coefficients Efficiently
7.1.7 Percent Increase and Decrease
7.1.8 Simple Interest
Section 7.2
7.2.1 Finding Missing Information in Proportional Relationships
7.2.2 Solving Proportions
Chapter Closure
Section 8.1
8.1.1 Measurement Precision
8.1.2 Comparing Distributions
Section 8.2
8.2.1 Representative Samples
8.2.2 Inference from Random Samples
Section 8.3
8.3.1 Introduction to Angles
8.3.2 Classifying Angles
8.3.3 Constructing Shapes
8.3.4 Building Triangles
Chapter Closure
Section 9.1
9.1.1 Circumference, Diameter, and Pi
9.1.2 Area of Circles
9.1.3 Area of Composite Shapes
Section 9.2
9.2.1 Surface Area and Volume
9.2.2 Cross Sections
9.2.3 Volume of a Prism
9.2.4 Volume of Non-Rectangular Prisms
Chapter Closure
Section 9.3
9.3.1 Volume and Scaling
9.3.2 Using Multiple Math Ideas to Create an Interior Design
9.3.3 Applying Ratios
Checkpoint 1: Area and Perimeter of Polygons
Checkpoint 2: Multiple Representations of Portions
Checkpoint 3: Multiplying Fractions and Decimals
Checkpoint 5: Order of Operations
Checkpoint 6: Writing and Evaluating Algebraic Expressions
Checkpoint 7A: Simplifying Expressions
Checkpoint 7B: Displays of Data: Histograms and Box Plots
Checkpoint 8: Solving Multi-Step Equations
Checkpoint 9: Unit Rates and Proportions
Section 11.1
11.1.1 Transforming Functions
11.1.2 Inverse Functions
Section 11.2
11.2.1 Investigating Data Representations
11.2.2 Comparing Data
11.2.3 Standard Deviation
Section 11.3
11.3.1 Using a Best-Fit Line to Make a Prediction
11.3.2 Relation Treasure Hunt
11.3.3 Investigating a Complex Function
11.3.4 Using Algebra to Find a Maximum
11.3.5 Exponential Functions and Linear Inequalities
Chapter Closure
Section A.1
A.1.1 Exploring Variables and Combining Like Terms
A.1.2 Simplifying Expressions by Combining Like Terms
A.1.3 Writing Algebraic Expressions
A.1.4 Using Zero to Simplify Algebraic Expressions
A.1.5 Using Algebra Tiles to Simplify Algebraic Expressions
A.1.6 Using Algebra Tiles to Compare Expressions
A.1.7 Simplifying and Recording Work
A.1.8 Using Algebra Tiles to Solve for x
A.1.9 More Solving Equations
Chapter Closure
Checkpoint 1: Solving Problems with Linear and Exponential Relationships
Checkpoint 2: Calculating Areas and Perimeters of Complex Shapes
Checkpoint 3: Angle Relationships in Geometric Figures
Checkpoint 4: Solving Proportions and Similar Figures
Checkpoint 5: Calculating Probabilities
Checkpoint 7: Factoring Quadratic Expressions
Checkpoint 8: Applying Trigonometric Ratios and the Pythagorean Theorem
Checkpoint 9: The Quadratic Web
Checkpoint 10: Solving Quadratic Equations
Checkpoint 11: Angle Measures and Areas of Regular Polygons
Checkpoint 12: Circles, Arcs, Sectors, Chords, and Tangents
Section 6.1
6.1.1 Rigid Transformations
6.1.2 Rigid Transformations on a Coordinate Graph
6.1.3 Describing Transformations
6.1.4 Using Rigid Transformations
Section 6.2
6.2.1 Multiplication and Dilation
6.2.2 Dilations and Similar Figures
6.2.3 Identifying Similar Shapes
6.2.4 Similar Figures and Transformations
6.2.5 Working With Corresponding Sides
6.2.6 Solving Problems Involving Similar Shapes
Chapter Closure
Section 7.1
7.1.1 Circle Graphs
7.1.2 Organizing Data in a Scatterplot
7.1.3 Identifying and Describing Association
Section 7.2
7.2.1 y = mx + b Revisited
7.2.2 Slope
7.2.3 Slope in Different Representations
7.2.4 More About Slope
7.2.5 Proportional Equations
Section 7.3
7.3.1 Using Equations to Make Predictions
7.3.2 Describing Association Fully
7.3.3 Association Between Categorical Variables
Chapter Closure
Section 8.1
8.1.1 Patterns of Growth in Tables and Graphs
8.1.2 Compound Interest
8.1.3 Linear and Exponential Growth
Section 8.2
8.2.1 Exponents and Scientific Notation
8.2.2 Exponent Rules
8.2.3 Negative Exponents
8.2.4 Operations with Scientific Notation
Section 8.3
8.3.1 Functions in Graphs and Tables
Chapter Closure
Section 9.1
9.1.1 Parallel Line Angle Pair Relationships
9.1.2 Finding Unknown Angles in Triangles
9.1.3 Exterior Angles in Triangles
9.1.4 AA Triangle Similarity
Section 9.2
9.2.1 Side Lengths and Triangles
9.2.2 Pythagorean Theorem
9.2.3 Understanding Square Root
9.2.4 Real Numbers
9.2.5 Applications of the Pythagorean Theorem
9.2.6 Pythagorean Theorem in Three Dimensions
9.2.7 Pythagorean Theorem Proofs
Chapter Closure
Section 10.1
10.1.1 Cube Roots
10.1.2 Surface Area and Volume of a Cylinder
10.1.3 Volumes of Cones and Pyramids
10.1.4 Volume of a Sphere
10.1.5 Applications of Volume
Chapter Closure
10.2.1 Indirect Measurement
10.2.2 Finding Unknowns
10.2.3 Analyzing Data to Identify a Trend
1. Operations with Signed Fractions and Decimals
2. Evaluating Expressions and Using Order of Operations
3. Unit Rates and Proportions
4. Area and Perimeter of Circles and Composite Figures
5. Solving Equations
6. Multiple Representations of Linear Equations
7. Solving Equations with Fractions and Decimals (Fraction Busters)
8. Transformations
9. Scatterplots and Association
Section 11.1
11.1.1 Simulations of Probability
11.1.2 More Simulations of Probability
11.1.3 Simulating Sampling Variability
Section 11.2
11.2.1 Statistical Test Using Sampling Variability
11.2.2 Variability in Experimental Results
11.2.3 Quality Control
11.2.4 Statistical Process Control
Section 11.3
11.3.1 Analyzing Decisions and Strategies
Chapter Closure
Section 12.1
12.1.1 Analyzing Trigonometric Equations
12.1.2 Solutions to Trigonometric Equations
12.1.3 Inverses of Trigonometric Functions
12.1.4 Reciprocal Trigonometric Functions
Section 12.2
12.2.1 Trigonometric Identities
12.2.2 Proving Trigonometric Identities
12.2.3 Angle Sum and Difference Identities
Chapter Closure
Section 1.1
1.1.1 Solving Puzzles in Teams
1.1.2 Investigating the Growth of Patterns
1.1.3 Multiple Representations of Functions
Section 1.2
1.2.1 Function Machines
1.2.2 Functions
1.2.3 Domain and Range
Section 1.3
1.3.1 Rewriting Expressions with Exponents
1.3.2 Zero and Negative Exponents
Chapter Closure
Section 2.1
2.1.1 Seeing Growth in Linear Functions
2.1.2 Comparing Δy and Δx
2.1.3 Slope
2.1.4 y= mx+ band More on Slope
Section 2.2
2.2.1 Modeling Linear Functions
2.2.2 Rate of Change
2.2.3 Equations of Lines in a Situation
2.2.4 Dimensional Analysis
Section 2.3
2.3.1 WritingtheEquation of a Line Given theSlope and a Point
2.3.2 Writingthe Equation of a Line Through Two Points
2.3.3 Writing y= mx+ b from Graphs and Tables
Chapter Closure
Section 3.1
3.1.1 Spatial Visualization and Reflections
3.1.2 Rotations and Translations
3.1.3 Slopes of Parallel and Perpendicular Lines
3.1.4 Defining Rigid Transformations
3.1.5 Using Transformations to Create Polygons
3.1.6 Symmetry
Section 3.2
3.2.1 Modeling Area and Perimeter with Algebra Tiles
3.2.2 Exploring an Area Model
3.2.3 Multiplying Polynomials and the Distributive Property
Section 3.3
3.3.1 Multiple Methods for Solving Equations
3.3.2 Fraction Busters
3.3.3 Solving Exponential and Complex Equations
Chapter Closure
Section 4.1
4.1.1 Line of Best Fit
4.1.2 Residuals
4.1.3 Upper and Lower Bounds
4.1.4 Least Squares Regression Line
Section 4.2
4.2.1 Residual Plots
4.2.2 Correlation
4.2.3 Association is Not Causation
4.2.4 Interpreting Correlation in Context
Chapter Closure
Section 5.1
5.1.1 Representing Exponential Growth
5.1.2 Rebound Ratios
5.1.3 The Bouncing Ball and Exponential Decay
Section 5.2
5.2.1 Generating and Investigating Sequences
5.2.2 Generalizing Arithmetic Sequences
5.2.3 Recursive Sequences
Section 5.3
5.3.1 ComparingGrowth in Tables and Graphs
5.3.2 Using Multipliers to Solve Problems
5.3.3 Comparing Sequences to Functions
Chapter Closure
Section 6.1
6.1.1 Working with Multi-Variable Equations
6.1.2 Summary of SolvingEquations
6.1.3 Solving Word Problems by Using Different Representations
6.1.4 Solving WordProblems by Writing Equations
Section 6.2
6.2.1 Solving Systems of Equations Using the Equal ValuesMethod
6.2.2 Solving Systems of Equations Using Substitution
6.2.3 Making Connections: Systems andMultiple Representation
Section 6.3
6.3.1 Solving Systems Using Elimination
6.3.2 More Elimination
6.3.3 Making Connections: Systems, Solutions, and Graphs
Section 6.4
6.4.1 Choosing a Strategy for Solving a System
6.4.2 Pulling it all Together
Chapter Closure
Section 7.1
7.1.1 Defining Congruence
7.1.2 Conditions for Triangle Congruence
7.1.3 Creating a Flowchart
7.1.4 Justifying Triangle CongruenceUsing Flowcharts
7.1.5 More Conditions for Triangle Congruence
7.1.6 Congruence of Triangles Through Rigid Transformations3947.1.7More Congruence Flowcharts
Section 7.2
7.2.1 Studying Quadrilaterals on a Coordinate Grid
7.2.2 Coordinate Geometry and Midpoints4
7.2.3 Identifying Quadrilaterals on a Coordinate Grid
Chapter Closure
Section 8.1
8.1.1 Investigating
8.1.2 Multiple Representations of Exponential Functions
8.1.3 More Applications of Exponential Functions
8.1.4 Exponential Decay
8.1.5 Graph →Equation
8.1.6 Completing the Multiple Representations Web
Section 8.2
8.2.1 Curve Fitting
8.2.2 Curved Best-Fit Models
8.2.3 Solving a System of Exponential Functions Graphically
Chapter Closure
Section 9.1
9.1.1 Solving Linear, One-Variable Inequalities
9.1.2 More Solving Inequalities
9.1.3 Solving Absolute Value Equations and Inequalities
Section 9.2
9.2.1 Graphing Two-Variable Inequalities
9.2.2 Graphing Linear and Nonlinear Inequalities
Section 9.3
9.3.1 Systems of Inequalities
9.3.2 More Systems of Inequalities
9.3.3 Applying Inequalities to Solve Problems
Chapter Closure
Section 10.1
10.1.1 Association in Two-Way Tables
10.1.2 Investigating Data Representations
10.1.3 Comparing Data
10.1.4 Standard Deviation
Section 10.2
10.2.1 Transforming Functions
10.2.2 Arithmetic Operations with Functions
10.2.3 Proving Linear and Exponential GrowthPatterns
Chapter Closure
Section 11.1 11.1.1 Introduction to Constructions
11.1.2 Constructing Bisectors
11.1.3 More Explorations with Constructions
Section 11.2
11.2.1 Solving Work and Mixing Problems
11.2.2 Solving Equations and Systems Graphically
11.2.3 Using a Best-Fit Line to Make a Prediction
11.2.4 Treasure Hunt
11.2.5 Using Coordinate Geometry and Constructions to Explore Shapes
11.2.6 Modeling with Exponential Functions and Linear Inequalities
Chapter Closure
Section A.1
A.1.1 Exploring Variables and Expressions
A.1.2 Using Zero to Simplify Algebraic Expressions
A.1.3 Using Algebra Tiles to Compare Expressions
A.1.4 Justifying and Recording Work
A.1.5 Using Algebra Tiles to Solve for x
A.1.6 More Solving Equations
A.1.7 Checking Solutions
A.1.8 Determining the Number of Solutions
A.1.9 UsingEquations to Solve Problems
Appendix Closure
Checkpoint1: Solving Linear Equations, Part 1 (Integer Coefficients)
Checkpoint 2: Evaluating Expressions and the Order of Operations
Checkpoint 3: Operations with Rational Numbers
Checkpoint 4: Laws of Exponents and Scientific Notation
Checkpoint 5: Writing the Equation of a Line
Checkpoint 6A: Solving Linear Equations, Part 2 (Fractional Coefficients)
Checkpoint 6B: Multiplying Binomials and Solving Equations with Parentheses
Checkpoint 7: Interpreting Associations
Checkpoint 8A: Rewriting Equations with More Than One Variable
Checkpoint 8B: Solving Problems by Writing Equations
Checkpoint 9: Solving Linear Systems of Equations
Checkpoint 10: Determining Congruent Triangles
Checkpoint 11: The Exponential Web
Section 1.1
1.1.1 Attributes of Polygons
1.1.2 More Attributes of Polygons
Section 1.2
1.2.1 Making Predictions and Investigating Results
1.2.2 Perimeters and Areas of Enlarging Patterns
11.2.3 Area as a Product and a Sum
1.2.4 Describing a Graph
Section 1.3
1.3.1 Angle Pair Relationships
1.3.2 Angles Formed by Transversals
1.3.3 More Angles Formed by Transversals
1.3.4 Angles and Sides of a Triangle
Chapter Closure
Section 2.1
2.1.1 Triangle Congruence Theorems
2.1.2 Flowcharts for Congruence
2.1.3 Converses
2.1.4 Proof by Contradiction
Section 2.2
2.2.1 Dilations
2.2.2 Similarity
Section 2.3
2.3.1 Conditions for Triangle Similarity
2.3.2 Determining Similar Triangles
2.3.3 Applying Similarity
2.3.4 Similar Triangle Proofs
Chapter Closure
Section 3.1
3.1.1 Using an Area Model
3.1.2 Using a Tree Diagram
3.1.3 Probability Models
3.1.4 Unions, Intersections, and Complements
3.1.5 Expected Value
Section 3.2
3.2.1 Constant Ratios in Right Triangles
3.2.2 Connecting Slope Ratios to Specific Angles
3.2.3 Expanding the Trig Table
3.2.4 The Tangent Ratio
3.2.5 Applying the Tangent Ratio
Chapter Closure
Section 4.1
4.1.1 Introduction to Factoring Expressions
4.1.2 Factoring with Area Models
4.1.3 Factoring More Quadratics
4.1.4 Factoring Completely
4.1.5 Factoring Special Cases
Section 4.2
4.2.1 Sine and Cosine Ratios
4.2.2 Selecting a Trig Tool
4.2.3 Inverse Trigonometry
4.2.4 Trigonometric Applications
Chapter Closure
Section 5.1
5.1.1 Investigating the Graphs of Quadratic Functions
5.1.2 Multiple Representations of Quadratic Functions
5.1.3 Zero Product Property
5.1.4 Writing Equations for Quadratic Functions
5.1.5 Completing the Quadratic Web
Section 5.2
5.2.1 Perfect Square Equations
5.2.2 Completing the Square
5.2.3 More Completing the Square
5.2.4 Introduction to the Quadratic Formula
5.2.5 Solving and Applying Quadratic Equations
5.2.6 Introducing Complex Numbers
Chapter Closure
Section 6.1
6.1.1 Special Right Triangles
6.1.2 Pythagorean Triples
6.1.3 Special Right Triangles and Trigonometry
6.1.4 Radicals and Fractional Exponents
Section 6.2
6.2.1 At Your Service
6.2.2 Angles on a Pool Table
6.2.3 Shortest Distance Problems
6.2.4 The Number System and Deriving the Quadratic Formula
6.2.5 Using Algebra to Find a Maximum
6.2.6 Analyzing a Game
Chapter Closure
Section 7.1
7.1.1 Explore-Conjecture-Prove
7.1.2 Properties of Rhombi
7.1.3 Two Column Proofs
7.1.4 More Geometric Proofs
7.1.5 Using SimilarTriangles to Prove Theorems
Section 7.2
7.2.1 Conditional Probability and Independence
7.2.2 More Conditional Probability
7.2.3 Applications of Probability
Chapter Closure
Section 8.1
8.1.1 Constructing Triangle Centers
Section 8.2
8.2.1 Angles of Polygons
8.2.2 Areas of Regular Polygons
Section 8.3
8.3.1 Area Ratios of Similar Figures
8.3.2 Ratios of Similarity
Section 8.4
8.4.1 A Special Ratio
8.4.2 Arcs and Sectors
8.4.3 Circles in Context
Chapter Closure
Section 9.1
9.1.1 Modeling Nonlinear Data
9.1.2 Parabola Investigation
9.1.3 Graphing Form of a Quadratic Function
9.1.4 Transforming the Absolute Value Function
Section 9.2
9.2.1 Quadratic Applications with Inequalities
9.2.2 Solving Systems of Equations
Section 9.3
9.3.1 Average Rate of Change and Projectile Motion5099.3.2Comparing the Growth of Functions
9.3.3 Piecewise-Defined Functions
9.3.4 Combining Functions
Section 9.4
9.4.1 Inverse Functions
Chapter Closure
Section 10.1
10.1.1 The Equation of a Circle
10.1.2 Completing the Square for Equations of Circles
10.1.3 The Geometric Definition of a Parabola
Section 10.2
10.2.1 Introduction to Chords
10.2.2 Angles and Arcs
10.2.3 Chords and Angles
10.2.4 Tangents
10.2.5 Tangents and Arcs
Chapter Closure
Section 11.1
11.1.1 Prisms and Cylinders
11.1.2 Volumes of Similar Solids
11.1.3 Ratios of Similarity
Section 11.2
11.2.1 Volume of a Pyramid
11.2.2 Surface Area and Volume of a Cone
11.2.3 Surface Area and Volume of a Sphere
Chapter Closure
Section 12.1
12.1.1 The Fundamental Counting Principle
12.1.2 Permutations
12.1.3 Combinations
12.1.4 Categorizing Counting Problems
Section 12.2
12.2.1 Using Geometry to CalculateProbabilities
12.2.2 Choosing a Model
12.2.3 The Golden Ratio
12.2.4 Some Challenging Probability Problems
Chapter Closure
Checkpoint 1: Solving Problems with Linear and Exponential Relationships
Checkpoint 2: Calculating Areas and Perimeters of Complex Shapes
Checkpoint 3: Angle Relationships in Geometric Figures
Checkpoint 4: Solving Proportions and Similar Figures
Checkpoint 5: Calculating Probabilities
Checkpoint 7: Factoring Quadratic Expressions
Checkpoint 8: Applying Trigonometric Ratios and the Pythagorean Theorem
Checkpoint 9: The Quadratic Web
Checkpoint 10: Solving Quadratic Equations
Checkpoint 11: Angle Measures and Areas of Regular Polygons
Checkpoint 12: Circles, Arcs, Sectors, Chords, and Tangents
Section 1.1
1.1.1 Solving a Function Puzzle in Teams
1.1.2 Using a Graphing Calculator to Explore a Function
1.1.3 Function Investigation
1.1.4 Combining Linear Functions
Section 1.2
1.2.1Representing Points of Intersection
1.2.2 Modeling a Geometric Relationship
1.2.3 Describing Data
Chapter Closure
Section 2.1
2.1.1 Transforming Quadratic Functions
2.1.2 Modeling with Parabolas
Section 2.2
2.2.1 Transforming Other Parent Graphs
2.2.2 Describing (h,k) for Each Family of Functions
2.2.3 Transformations of Functions 2.2.4 TransformingNon-Functions
2.2.5 Developing a Mathematical Model
Section 2.3
2.3.1 Completing the Square
Chapter Closure
Section 3.1
3.1.1 Strategies for Solving Equations
3.1.2 Solving Equations Graphically
3.1.3 Multiple Solutions to Systems of Equations
3.1.4 Using Systems of Equations to Solve Problems
Section 3.2
3.2.1 Solving Inequalities with One or Two Variables
3.2.2 Using Systems to Solve a Problem
3.2.3 Applications of Systems of Inequalities
3.2.4 Using Graphs to DetermineSolutions
Chapter Closure
Section 4.1
4.1.1 Survey Design
4.1.2Samples and the Role of Randomness
4.1.3 Bias in Convenience Samples
Section 4.2
4.2.1 Testing Cause and Effect with Experiments
4.2.2 Conclusions from Studies
Section 4.3
4.3.1Relative Frequency Histograms
4.3.2 The Normal Probability Density Function
4.3.3 Percentiles
Section 4.4
4.4.1 Cross-Sections and Solids of a Revolution
4.4.2 Modeling with Geometric Solids
4.4.3 Designing to Meet Constraints
Chapter Closure
Section 5.1
5.1.1 “Undo” Equations
5.1.2 Using a Graph to Find an Inverse
5.1.3 More Inverse Functions
Section 5.2
5.2.1 TheInverse of an Exponential Function
5.2.2 Defining the Inverse of an Exponential Function
5.2.3 Investigating the Family of Logarithmic Functions
5.2.4 Transformations of Logarithmic Functions
Chapter Closure
Section 6.1
6.1.1 Simulations of Probability
6.1.2 More Simulations of Probability
6.1.3 Simulating Sampling Variability
Section 6.2
6.2.1 Statistical Test Using Sampling Variability
6.2.2 Variability in Experimental Results
6.2.3 Quality Control
6.2.4 Statistical Process Control
Section 6.3
6.3.1 Analyzing Decisions and Strategies
Chapter Closure
Section 7.1
7.1.1 Using Logarithms to Solve Exponential Equations
7.1.2 Investigating the Properties of Logarithms
7.1.3 Writing Equations of Exponential Functions
7.1.4 An Application of Logarithms
Section 7.2
7.2.1 Determining Missing Parts of Triangles
7.2.2 Law of Sines
7.2.3 Law of Cosines
7.2.4 The Ambiguous Case
7.2.5 Choosing a Tool
Chapter Closure
Section 8.1
8.1.1 Sketching Graphs of Polynomial Functions
8.1.2 More Graphs of Polynomial Functions
8.1.3 Stretch Factors for Polynomial Functions
Section 8.2
8.2.1 Writing Equations Using Complex Roots
8.2.2 More Real and Complex Roots
Section 8.3
8.3.1 Polynomial Division
8.3.2 Factors and Rational Zeros
8.3.3 An Application of Polynomials
8.3.4 Special Cases of Factoring
Chapter Closure
Section 9.1
9.1.1 Introductions to Periodic Models
9.1.2 Graphing the Sine Functions
9.1.3 Unit Circle ↔Graph
9.1.4 Graphing and Interpreting the Cosine Function
9.1.5 Defining a Radian
9.1.6 Building a Unit Circle
9.1.7 The Tangent Function
Section 9.2 9.2.1 Transformations of y= sin(x)
9.2.2 One More Parameter for a Periodic Function
9.2.3 Period of a Trigonometric Function
9.2.4 Graph ↔Equation
Chapter Closure
Section 10.1
10.1.1 Introduction to Arithmetic Series
10.1.2 More Arithmetic Series
10.1.3 General Arithmetic Series
10.1.4 Summation Notation and Combinations of Series
10.1.5 Mathematical Induction
Section 10.2
]10.2.1 Geometric Series
10.2.2 Infinite Series
Section 10.3
10.3.1 Using a Binomial Probability Model
10.3.2 Pascal’s Triangle and the Binomial Theorem
10.3.3 The Number e
Chapter Closure
Section 11.1
11.1.1 Simplifying Rational Expressions
11.1.2 Multiplying and Dividing Rational Expressions
11.1.3 Adding and Subtracting Rational Expressions
11.1.4 Operations with Rational Expressions
Section 11.2
11.2.1 Creating a Three-Dimensional Model
11.2.2 Graphing Equations in Three Dimensions
11.2.3 Solving Systems of Three Equations with Three Variables
11.2.4 Using Systems of Three Equations for Curve Fitting
Chapter Closure
Section 12.1
12.1.1 Analyzing Trigonometric Equations
12.1.2 Solutions to TrigonometricEquations
12.1.3 Inverses of Trigonometric Functions
12.1.4 Reciprocal Trigonometric Functions
Section 12.2
12.2.1 Trigonometric Identities
12.2.2 Proving Trigonometric Identities
12.2.3 Angle Sum and Difference Identities
Chapter Closure
Checkpoint 2: Solving Quadratic Equations
Checkpoint 3: Function Notation and Describing a Function
Checkpoint 4: Expressions with Integer and Rational Exponents
Checkpoint 5: Transformations of Functions
Checkpoint 6: Solving Complicated Equations and Systems
Checkpoint 7: Solving and Graphing Inequalities
Checkpoint 8: Determining the Equation for the Inverse of a Function
Checkpoint 9A: Solving Equations with Exponents
Checkpoint 9B: Rewriting Expressions and Solving Equations with Logarithms
Checkpoint 10: Solving Triangles
Checkpoint 11: Roots and Graphs of Polynomial Functions
Checkpoint 12: Periodic Functions
Sección 1.1
1.1.1 Resolución de acertijos en equipo
1.1.2 Investigar el crecimiento de patrones
1.1.3 Investigación de los gráficos de funciones cuadráticas
Sección 1.2
1.2.1 Descripción de un gráfico
1.2.2 Raíz cúbica y funciones de valor absoluto
1.2.3 Máquinas de funciones
1.2.4 Funciones
1.2.5 Dominio y rango
Resumen del Capítulo
Sección 2.1
2.1.1 Observación del crecimiento en las representaciones lineales
2.1.2 Pendiente
2.1.3 Comparación de Δy y Δx
2.1.4 y = mx + b y más información sobre pendientes
Sección 2.2
2.2.1 Pendiente como movimiento
2.2.2 Tasa de cambio
2.2.3 Ecuaciones de rectas en situaciones dadas
Sección 2.3
2.3.1 Hallar una ecuación a partir de la pendiente y un punto
2.3.2 Cómo hallar la ecuación de una recta que atraviesa dos puntos
Actividad de extensión Cómo hallar y = mx + b a partir de gráficos y tablas
Resumen del Capítulo
Sección 3.1
3.1.1 Simplificación de expresiones exponenciales
3.1.2 Exponentes negativos eiguales a cero
Sección 3.2
3.2.1 Ecuaciones ↔ azulejos algebraicos
3.2.2 Exploración de modelos de área
3.2.3 Multiplicación de binomios y la Propiedad distributiva
3.2.4 Uso de rectángulos genéricos para multiplicar
Sección 3.3
3.3.1 Resolver ecuaciones conmultiplicaciones y valores absolutos
3.3.2 Trabajando con ecuaciones con múltiples variables
3.3.3 Resumen de la resolución de ecuaciones
Resumen del Capítulo
Sección 4.1
4.1.1 Resolución de
problemas de palabras con
4.1.2 ¿Una ecuación o dos
Sección 4.2
4.2.1 Resolución de sistemas de ecuaciones por sustitución
4.2.2 Realizar conexiones: sistemas, soluciones, y gráficos
4.2.3 Resolución de sistemas por medio de la eliminación
4.2.4 Más información sobre el método de eliminación
4.2.5 Selección de una estrategia para la resolución de sistemas
Sección 4.3
4.3.1 Unificar todoResumen del Capítulo
Opening | 5.OP | Chapter Opening |
---|---|---|
Section 5.1 | 5.1.1 | Representing Fraction Multiplication |
5.1.2 | Describing Parts of Parts | |
5.1.3 | Calculating Parts of Parts | |
5.1.4 | Multiplying Mixed Numbers | |
Section 5.2 | 5.2.1 | Making Sense of Decimal Multiplication |
5.2.2 | Fraction Multiplication Number Sense | |
Section 5.3 | 5.3.1 | Rearranging Areas |
5.3.2 | Area of a Parallelogram | |
5.3.3 | Area of a Triangle | |
5.3.4 | Area of a Trapezoid | |
Closure | 5.CL | Chapter Closure |
Section 5.4 | Mid-Course Reflection Activities |
Sección 6.1
6.1.1 Recta de mejor ajuste
6.1.2 Valores residuales
6.1.3 Cota superior y cota inferior
6.1.4 Línea de regresión de mínimos cuadrados
Sección 6.2
6.2.1 Diagramas de valor residual
6.2.2 Correlación
6.2.3 Asociación no es causalidad
6.2.4 Interpretación de la correlación en contexto
6.2.5 Modelos de mejor ajuste curvos
Resumen del Capítulo
Sección 7.1
7.1.1 Investigar y = b x
7.1.2 Múltiples representaciones de funciones exponenciales
7.1.3 Más aplicaciones del crecimiento exponencial
7.1.4 Decaimiento exponencial
7.1.5 Gráfico → ecuación
7.1.6 Completar la red de representaciones múltiples
Sección 7.2
7.2.1 Curvas de ajuste y exponentes fraccionarios
7.2.2 Más curvas de ajuste
7.2.3 Resolución gráfica de un sistema de funciones exponenciales
Resumen del Capítulo
Sección 8.1
8.1.1 Introducción a la factorización de expresiones cuadráticas
8.1.2 Factorización con rectángulos genéricos
8.1.3 Factorización en casos especiales
8.1.4 Factorizar completamente
8.1.5 Atajos de factorización
Sección 8.2
8.2.1 Múltiples representaciones de funciones cuadráticas
8.2.2 Propiedad de producto cero
8.2.3 Más formas de hallar puntos de corte con el eje x
8.2.4 Completar la red cuadrática
8.2.5 Completar cuadrados
Resumen del Capítulo
Sección 9.1
9.1.1 Resolución de ecuaciones cuadráticas
9.1.2 Introducción a la Fórmula cuadrática
9.1.3 Más ecuaciones cuadráticas
9.1.4 Elección de una estrategia
Sección 9.2
9.2.1 Resolución de desigualdades lineales de una variable
9.2.2 Más desigualdades
Sección 9.3
9.3.1 Graficación de desigualdades lineales con dos variables
9.3.2 Graficación de desigualdades lineales y no lineales
Sección 9.4
9.4.1 Sistemas de desigualdades
9.4.2 Más sistemas de desigualdades
9.4.3 Aplicación de desigualdades a la resolución de problemas
Resumen del Capítulo
Sección 10.1
10.1.1 Asociaciones en tablas de doble entrada
Sección 10.2
10.2.1 Resolver reescribiend
10.2.2 Rompe fracciones
10.2.3 Múltiples métodos de resolución de ecuaciones
10.2.4 Determinar la cantidad de soluciones
10.2.5 Derivación de la Fórmula cuadrática y el sistema numérico
10.2.6 Más información sobre resolución y aplicaciones
Sección 10.3
10.3.1 Intersección de dos funciones
10.3.2 Cantidad de intersecciones de una parábola
10.3.3 Resolución de ecuaciones cuadráticas y con valores absolutos
Resumen del Capítulo
Sección 11.1
11.1.1 Transformación de funciones
11.1.2 Funciones inversas
Sección 11.2
11.2.1 Investigación de representaciones de datos
11.2.2 Comparación de datos
11.2.3 Desviación estándar
Sección 11.3
11.3.1 Uso de una recta de mejor ajuste para realizar predicciones
11.3.2 Búsqueda del tesoro de relaciones
11.3.3 Investigación de una función compleja
11.3.4 Uso del álgebra para hallar un máximo
11.3.5 Funciones exponenciales y desigualdades lineales
Resumen del Capítulo6
Sección A.1
A.1.1 Exploración de variables y agrupación de términos semejantes
A.1.2 Simplificación de expresiones combinando términos semejantes
A.1.3 Escritura de expresiones algebraicas
A.1.4 Uso del cero para simplificar expresiones algebraicas
A.1.5 Uso de azulejos algebraicos para simplificar expresiones algebraicas
A.1.6 Uso de azulejos algebraicos para comparar expresiones
A.1.7 Simplificación y registro del trabajo
A.1.8 Uso de azulejos algebraicos para resolver para
x
A.1.9 Más ecuaciones para resolver
Resumen del Apéndic
Sección1.1
1.1.1 Creación de una manta usando la simetría
1.1.2 Cómo hacer predicciones e investigar los resultados
1.1.3 Perímetro yárea de patrones de azulejos que se agrandan
1.1.4 Argumentos lógicos
1.1.5 Construcción de un caleidoscopio
Sección 1.2
1.2.1 Visualización espacial y reflexiones
1.2.2 Transformaciones rígidas: Rotaciones y traslaciones
1.2.3 Pendientes de rectas paralelas y perpendiculares
1.2.4 Definición de transformaciones
1.2.5 Uso de las transformaciones para crear formas
1.2.6 Simetría
Sección1.3
1.3.1 Atributos y características de las formas
1.3.2 Más características de las figuras
Resumen del Capítulo
Sección 2.1
2.1.1 Ángulos complementarios, suplementarios y opuestos por el vértice
2.1.2 Ángulos formados por transversales
2.1.3 Más ángulos formados por transversales
2.1.4 Ángulos de un triángulo
2.1.5 Aplicación de las relaciones entre ángulos1
Sección 2.2
2.2.1 Unidades de medida
2.2.2 Áreas de triángulos y figuras compuestas
2.2.3 Áreas de paralelogramos y trapecios
2.2.4 Alturas y áreas
Sección 2.3
2.3.1 Teorema de la desigualdad de un triángulo
2.3.2 El Teorema de Pitágoras
Resumen del Capítulo
Sección 3.1
3.1.1 Dilatación
3.1.2 Semejanzas
3.1.3 Uso de las razones de semejanza
3.1.4 Aplicaciones y notación
Sección3.2
3.2.1 Condiciones de semejanza de triángulos
3.2.2 Creación de un diagrama de flujo
3.2.3 Semejanza entre triángulos y congruencia
3.2.4 Más condiciones de semejanza de triángulos
3.2.5 Determinar semejanzas
3.2.6 Aplicación de la semejanza
Resumen del Capítulo
Sección4.1
4.1.1 Razones constantes en triángulos rectángulos
4.1.2 Relación entre razones de la pendiente y ángulos específicos
4.1.3 Ampliación de la tabla de trigonometría
4.1.4 La razón tangente
4.1.5 Aplicación de la razón tangente
Sección 4.2
4.2.1 Uso de un modelo de área
4.2.2 Uso de un diagrama de árbol
4.2.3 Modelos de probabilidad
4.2.4 Uniones, intersecciones y complementos
4.2.5Valor esperado
Resumen del Capítulo
Sección5.1
5.1.1 Razones seno y coseno
5.1.2 Elección de una herramienta de trigonometría
5.1.3 Trigonometría inversa
5.1.4 Aplicaciones trigonométricas
Sección5.2
5.2.1 Triángulos rectángulos especiales
5.2.2 Ternas pitagóricas
Sección 5.3
5.3.1 Cómo hallar las partes faltantes de los triángulos
5.3.2 Ley de los senos
5.3.3 Ley de los cosenos
5.3.4 Triángulos ambiguos(Optativo)
5.3.5 Elección de una herramienta
Resumen del Capítulo
Sección6.1
6.1.1Triángulos congruentes
6.1.2 Condiciones para congruencia de triángulos
6.1.3 Congruencia de triángulos a través de transformaciones rígidas3526.1.4Diagramas de flujo para congruencia
6.1.5 Recíprocos
Sección6.2
6.2.1 Ángulos sobre una mesa de pool
6.2.2 Investigar un triángulo
6.2.3 Creación de un modelomatemático
6.2.4 Análisis de un juego
6.2.5 Uso de transformaciones y simetría para diseñar copos de nieve
Resumen del Capítulo
Sección 7.1
7.1.1 Propiedades de un círculo
7.1.2 Construcción de un tetraedro
7.1.3 Problemas de distancia más corta
7.1.4 Uso de la simetría para el estudio de polígonos
Sección 7.2
7.2.1 Cuadriláteros especiales y demostraciones
7.2.2 Propiedades de los rombos
7.2.3 Más demostraciones con triángulos congruentes4297.2.4Más propiedades de los cuadriláteros
7.2.5 Demostraciones en dos columnas4387.2.6Explora-Conjetura-Demuestra
Sección 7.3
7.3.1 Estudio de cuadriláteros sobre una cuadrilla de coordenadas
7.3.2 Geometría en coordenadas y puntos medios
7.3.3 Cómo identificar cuadriláteros sobre una cuadrícula de coordenadas
Resumen del Capítulo
Sección 8.1
8.1.1 Molinillos y polígonos
8.1.2 Ángulos interiores de los polígonos
8.1.3 Ángulos de polígonos regulares
8.1.4 Conexiones de los ángulos de los polígonos regulares
8.1.5 Cómo calcular las áreas de polígonos regulares
Sección 8.2
8.2.1 Razones de área de figuras semejantes
8.2.2 Razones de semejanza
Sección 8.3
8.3.1 Una razón especial
8.3.2 Área y circunferencia de un círculo
8.3.3 Círculos en contexto
Resumen del Capítulo
Sección 9.1
9.1.1Sólidos tridimensionales
9.1.2 Volúmenes y áreasde superficies de los prismas
9.1.3 Prismas y cilindros
9.1.4 Volúmenes de sólidos similares
9.1.5 Razones de semejanza
Sección 9.2
9.2.1 Introducción a las construcciones5529.2.2Construcción de bisectrices
9.2.3 Más exploraciones con construcciones
9.2.4 Otras construcciones
Resumen del Capítulo
Sección 10.1
10.1.1 Introducción a las cuerdas
10.1.2 Ángulos y arcos
10.1.3 Cuerdas y ángulos
10.1.4 Tangentes y secantes
10.1.5 Resolver problemas con círculos
Sección 10.2
10.2.1 Probabilidad condicional e independencia’
10.2.2 Tablas de doble entrada
10.2.3 Aplicaciones de probabilidad
Sección10.3
10.3.1 El Principio fundamental de conteo
10.3.2 Permutaciones
10.3.3 Combinaciones
10.3.4 Categorizar problemas de conteo
10.3.5 Algunos problemas de probabilidad desafiantes
Resumen del Capítulo
Sección11.1
11.1.1 Sólidos platónicos
11.1.2 Pirámides
11.1.3 Volumen de una pirámide
11.1.4 Área de superficie y volumen de un cono
11.1.5 Área de superficie y volumen de una esfera
Sección 11.2
11.2.1 Coordenadas en una esfera
11.2.2 Tangentes y arcos
11.2.3 Relaciones de secantes y tangentes
Resumen del Capítulo
Sección 12.1
12.1.1 La ecuación de un círculo
12.1.2 Técnica de completar cuadrados para las ecuaciones de círculos
12.1.3 Introducción a las secciones cónicas
12.1.4 Graficación de una parábola usando el foco y la directriz
Sección 12.2
12.2.1 Uso de la geometría en coordenadas y las construcciones para explorar las formas
12.2.2 La Fórmula de los poliedros de Euler
12.2.3 La razón áurea
12.2.4 Uso de la geometría para hallar probabilidades
Resumen del Capítulo
Sección 1.1
1.1.1 Resolución de acertijos en equipo
1.1.2 Cómo usar una calculadora gráfica para explorar una función
1.1.3 Dominioy rango
1.1.4 Puntos de intersección en representaciones múltiples
Sección 1.2
1.2.1 Modelado de una relación geométrica
1.2.2 Investigación de funciones
1.2.3 La familia de funciones lineales
1.2.4 Reto de investigación de funciones
Resumen del Capítulo
Sección 2.1
2.1.1 Modelado de datos no lineales
2.1.2 Investigación sobre parábolas
2.1.3 Graficar una parábola sin una tabla
2.1.4 Reescribir en la forma de graficación
2.1.5 Modelación matemática con parábolas
Sección 2.2
2.2.1 Transformación de otros gráficos madre
2.2.2 Descripción de (h, k) para cada familia de funciones
2.2.3 Transformaciones de funciones
2.2.4 Transformación de ecuaciones que no son funciones
2.2.5 Transformación de funciones seccionadas
Resumen del Capítulo
Sección 3.1
3.1.1 Expresiones equivalentes
3.1.2 Reescribir expresiones y determinar equivalencias
3.1.3 Resolver reescribiendo
Sección 3.2
3.2.1 Investigación de funciones racionales
3.2.2 Simplificación de expresiones racionales
3.2.3 Multiplicación y división de expresiones racionales
3.2.4 Suma y resta de expresiones racionales1503.2.5Creación de nuevas funciones
Resumen del Capítulo
Sección 4.1
4.1.1 Estrategias de resolución de ecuaciones
4.1.2 Resolución de ecuaciones y sistemas en forma gráfica
4.1.3 Hallar múltiples soluciones a sistemas de ecuaciones
4.1.4 Uso de sistemas de ecuaciones para resolver problemas
Sección 4.2
4.2.1 Resolución de desigualdades con una o dos variables
4.2.2 Uso de sistemas para resolver un problema
4.2.3 Aplicación de los sistemas de desigualdades lineales
4.2.4 Uso de gráficos para hallar soluciones
Resumen del Capítulo
Sección 5.1
5.1.1 “Deshacer” ecuaciones
5.1.2 Usar un gráfico para hallar una inversa
5.1.3 Hallar inversas y justificar algebraicamente
Sección 5.2
5.2.1 Hallar la inversa de una función exponencial
5.2.2 Definir la inversa de una función exponencial
5.2.3 Investigar la familia de funciones logarítmicas
5.2.4 Transformaciones de funciones logarítmicas
5.2.5 Investigar composiciones de funciones
Resumen del Capítulo
Sección 6.1
6.1.1 Creación de un modelo tridimensional
6.1.2 Graficación de ecuaciones en tres dimensiones
6.1.3 Sistemas de tres ecuaciones variables
6.1.4 Resolución de sistemas de tres ecuaciones con tres incógnitas
6.1.5 Empleo de sistemas de tres ecuaciones para curvas de ajuste
Sección 6.2
6.2.1 Uso de logaritmos para resolver ecuaciones exponenciales
6.2.2 Investigación de las propiedades de los logaritmos
6.2.3 Escritura de ecuaciones de funciones exponenciales
6.2.4 Una aplicación de los logaritmos
Resumen del Capítulo
Sección 7.1
7.1.1 Introducción a los modelos cíclicos
7.1.2 Cómo graficar la función seno
7.1.3 Círculo de unidad↔Gráfico
7.1.4 Cómo graficar e interpretar la función coseno
7.1.5 Definición de radián
7.1.6 Construcción de un círculo de unidad
7.1.7 La función tangente
Sección 7.2
7.2.1 Transformaciones de y= sen x
7.2.2 Un parámetro más para una función cíclica
7.2.3 Período de una función cíclica
7.2.4 Gráfico↔Ecuación
Resumen del Capítulo
Sección 8.1
8.1.1 Cómo graficar funciones polinómicas
8.1.2 Más gráficos de polinomios
8.1.3 Factores de estiramiento para funciones polinómicas
Sección 8.2
8.2.1 Introducción a los números imaginarios
8.2.2 Raíces complejas
8.2.3 Más números complejos y ecuaciones
Sección 8.3
8.3.1 División de polinomios
8.3.2 Factores y raíces enteras
8.3.3 Una aplicación de polinomios
Resumen del Capítulo
Sección 9.1
9.1.1 Diseño de encuestas
9.1.2 Muestras y el rol de la aleatorización
9.1.3 Sesgo en muestras por conveniencia
Sección 9.2
9.2.1 Probando la causa y el efecto con experimentos
9.2.2 Conclusiones a partir de estudios
Sección 9.3
9.3.1 Histogramas de frecuencia relativa
9.3.2 La función de densidad de probabilidad normal
9.3.3 Percentiles
Resumen del Capítulo
Sección 10.1
10.1.1 Introducción a las series aritméticas
10.1.2 Más series aritméticas
10.1.3 Series aritméticas generales
10.1.4 Notación de suma y combinaciones de series
Sección10.2
10.2.1 Series geométricas
10.2.2 Series infinitas
Sección10.3
10.3.1 El triángulo de Pascal y el Teorema del binomio
10.3.2 El númeroe
Resumen del Capítulo
Sección 11.1
11.1.1 Simulaciones de probabilidad
11.1.2 Más simulaciones de probabilidad
11.1.3 Simulación de la variabilidad muestral
Sección 11.2
11.2.1 Evaluación estadística usando la variabilidad muestral
11.2.2 Variabilidad en los resultados experimentales
11.2.3 Control de calidad
11.2.4 Control estadístico de procesos
Sección 11.3
11.3.1 Análisis de decisiones y estrategias
Resumen del Capítulo
Sección 12.1
12.1.1 Analizando ecuaciones trigonométricas
12.1.2 Soluciones de las ecuaciones trigonométricas
12.1.3 Inversas de las funciones trigonométricas
12.1.4 Funciones trigonométrica recíprocas
Sección 12.2 12.2.1 Identidades trigonométricas
12.2.2 Demostrando identidades trigonométricas
12.2.3 Identidades de suma y diferencia de ángulos
Resumen del Capítulo
Sección A.1
A.1.1 Representación del crecimiento exponencia
A.1.2 Razones de rebote
A.1.3 El balón que rebota y el decaimiento exponencial
Sección A.2
A.2.1 Generación e investigación de progresiones
A.2.2 Generalización de progresiones aritméticas
A.2.3 Progresiones recurrentes
SecciónA.3
A.3.1 Patrones de crecimiento en tablas y gráficos
A.3.2 Uso de multiplicadores para resolver problemas
‘A.3.3 Comparación de progresiones y funciones
Resumen del Apéndice
Sección B.1
B.1.1 Investigar y= bx
B.1.2 Múltiples representaciones de funciones exponenciales
B.1.3 Más aplicaciones del crecimiento exponencial
B.1.4 Decaimiento exponencial
B.1.5 Gráfico →ecuación
B.1.6 Completar la red de representaciones múltiples
Sección B.2
B.2.1 Curvas de ajuste y exponentes fraccionariosB31B.2.2Más curvas de ajuste
B.2.3 Resolución gráfica de un sistema de funciones exponenciales
Resumen del Apéndice
Sección C.1
C.1.1 Investigación de representaciones de datos
C.1.2 Comparación de datos
C.1.3 Desviación estándar
Section 1.1
1.1.1 Solving Puzzles in Teams
1.1.2
Investigating the Growth of Patterns
1.1.3 Investigating the Graphs of Quadratic Functions
Section 1.2
1.2.1 Describing a
Graph
1.2.2 Cube Root and Absolute Value Functions
1.2.3 Function Machines
1.2.4 Functions
1.2.5 Domain and Range
Chapter Closure
Section 2.1
2.1.1 Seeing Growth in Linear Representations
2.1.2 Slope
2.1.3 Comparing Δy and Δx
2.1.4 y = mx + b and More on Slope
Section 2.2
2.2.1 Slope as Motion
2.2.2 Rate of Change
2.2.3 Equations of Lines in Situations
Section 2.3
2.3.1 Finding an Equation Given a Slope and a Point
2.3.2 Finding the Equation of a Line Through Two Points
Extension Activity Finding y = mx + b from Graphs and Tables
Chapter Closure
Section 3.1
3.1.1 Simplifying Exponential Expressions
3.1.2 Zero and Negative Exponents
Section 3.2
3.2.1 EquationsAlgebra Tiles
3.2.2 Exploring an Area Model
3.2.3 Multiplying Binomials and the Distributive Property
3.2.4 Using Generic Rectangles to Multiply
Section 3.3
3.3.1 Solving Equations With Multiplication and Absolute Value
3.3.2 Working With Multi-Variable Equations
3.3.3 Summary of Solving Equations
Chapter Closure
Section 4.1
4.1.1 Solving Word Problems by Writing Equations
4.1.2 One Equation or Two?
Section 4.2
4.2.1 Solving Systems of Equations Using Substitution
4.2.2 Making Connections: Systems, Solutions, and Graphs
4.2.3 Solving Systems Using Elimination
4.2.4 More Elimination
4.2.5 Choosing a Strategy for Solving Systems
Section 4.3
4.3.1 Pulling it all Together
Chapter Closure
Section 6.1
6.1.1 Line of Best Fit
6.1.2 Residuals
6.1.3 Upper and Lower Bounds
6.1.4 Least Squares Regression Line
Section 6.2
6.2.1 Residual Plots
6.2.2 Correlation
6.2.3 Association is N
ot Causation
6.2.4 Interpreting Correlation in Context
6.2.5 Curved Best – Fit
Models
Chapter Closure
Opening | 6.OP | Chapter Opening |
---|---|---|
Section 6.1 | 6.1.1 | Dividing |
6.1.2 | Fractions as Division Problems | |
6.1.3 | Problem Solving with Division | |
6.1.4 | Solving Problems Involving Fraction Division | |
Section 6.2 | 6.2.1 | Order of Operations |
6.2.2 | Area of a Rectangular Shape | |
6.2.3 | Naming Perimeters of Algebra Tiles | |
6.2.4 | Combining Like Terms | |
6.2.5 | Evaluating Algebraic Expressions | |
Closure | 6.CL | Chapter Closure |
Section 7.1
7.1.1 Investigating y= bx^3
7.1.2 Multiple Representations of Exponential Functions
7.1.3 More Applications of Exponential Growth
7.1.4 Exponential Decay
7.1.5 Graph→Equation
7.1.6 Completing the Multiple Representations Web
Section 7.2
7.2.1 Curve Fitting and Fractional Exponents
7.2.2 More Curve Fitting
7.2.3 Solving a System of Exponential Functions Graphically
Chapter Closure
Section 8.1
8.1.1 Introduction to Factoring Quadratics
8.1.2 Factoring with Generic Rectangles
8.1.3 Factoring with Special Cases
8.1.4 Factoring Completely
8.1.5 Factoring Shortcuts
Section 8.2
8.2.1 Multiple Representations for Quadratic Functions
8.2.2 Zero Product Property
8.2.3 More Ways To Find the x-Intercepts
8.2.4 Completing the Quadratic Web
8.2.5 Completing the Square
Chapter Closure
Section 9.1
9.1.1 Solving Quadratic Equations
9.1.2 Introduction to the Quadratic Formula
9.1.3 More Solving Quadratic Equations
9.1.4 Choosing a Strategy
Section 9.2
9.2.1 Solving Linear, One-Variable Inequalities
9.2.2 More Solving Inequalities
Section 9.3
9.3.1 Graphing Two-Variable Inequalities
9.3.2 Graphing Linear and Non-Linear Inequalities
Section 9.4
9.4.1 Systems of Inequalities
9.4.2 More Systems of Inequalities
9.4.3 Applying Inequalities to Solve Problems
Chapter Closure
Section 10.1
10.1.1 Association in Two-Way Tables
Section 10.2
10.2.1 Solving by Rewriting
10.2.2 Fraction Busters
10.2.3 Multiple Methods for Solving Equations
10.2.4 Determining the Number of Solutions
10.2.5 Deriving the Quadratic Formula and the Number System
10.2.6 More Solving and an Application
Section 10.3
10.3.1 Intersection of Two Functions
10.3.2 Number of Parabola Intersections
10.3.3 Solving Quadratic and Absolute Value Inequalities
Chapter Closure
Section 11.1
11.1.1 Transforming Functions
11.1.2 Inverse Functions
Section 11.2
11.2.1 Investigating Data Representations
11.2.2 Comparing Data’
11.2.3 Standard Deviation
Section 11.3
11.3.1 Using a Best-Fit Line to Make a Prediction
11.3.2 Relation Treasure Hunt
11.3.3 Investigating a Complex Function
11.3.4 Using Algebra to Find a Maximum
11.3.5 Exponential Functions and Linear Inequalities
Chapter Closure
Section A.1
A.1.1 Exploring Variables and Combining Like Terms
A.1.2 Simplifying Expressions by Combining Like Terms
A.1.3 Writing Algebraic Expressions
A.1.4 Using Zero to Simplify Algebraic Expressions
A.1.5 Using Algebra Tiles to Simplify Algebraic Expressions
A.1.6 Using Algebra Tiles to Compare Expressions
A.1.7 Simplifying and Recording Work
A.1.8 Using Algebra Tiles to Solve for x
A.1.9 More Solving Equations
Chapter Closure
Section 1.1
1.1.1 Creating Quilt Using Symmetry
1.1.2 Making Predictions and Investigating Results
1.1.3 Perimeters and Areas of Enlarging Tile Patterns
1.1.4 Logical Arguments
1.1.5 Building a Kaleidoscope
Section 1.2
1.2.1 Spatial Visualization and Reflection
1.2.2 Rigid Transformations: Rotation and Translations
1.2.3 Slope of Parallel and Perpendicular Lines
1.2.4 Defining Transformations
1.2.5 Using Transformations to Create Shapes
1.2.6 Symmetry
Section 1.3
1.3.1 Attributes and Characteristics of Shapes
1.3.2 More Characteristics of Shapes
Chapter Closure
Section 2.1
2.1.1 Complementary, Supplementary, and Vertical Angles
2.1.2 Angles Formed by Transversals
2.1.3 More Angles Formed by Transversals
2.1.4 Angles in a Triangle
2.1.5 Applying Angle Relationships
Section 2.2
2.2.1 Units of Measure
2.2.2 Areas of Triangles and Composite Shapes
2.2.3 Areas of Parallelograms and Trapezoids
2.2.4 Heights and Areas
Section 2.3
2.3.1 Triangle Inequality
2.3.2 The Pythagorean Theorem
Chapter Closure
Section 3.1
3.1.1 Dilations
3.1.2 Similarity
3.1.3 Using Ratios of Similarity
3.1.4 Applications and Notation
Section 3.2
3.2.1 Conditions for Triangle Similarity
3.2.2 Creating a Flowchart
3.2.3 Triangle Similarity and Congruence
3.2.4 More Conditions for TriangleSimilarity
3.2.5 Determining Similarity
3.2.6 Applying Similarity
Chapter Closure
Section 4.1
4.1.1 Constant Ratios in Right Triangles
4.1.2 Connecting Slope Ratios to Specific Angles
4.1.3 Expanding the Trig Table
4.1.4 The Tangent Ratio
4.1.5 Applying the Tangent Ratio
Section 4.2
4.2.1 Using an Area Model
4.2.2 Using a Tree Diagram
4.2.3 Probability Models
4.2.4 Unions, Intersections, and Complements
4.2.5 Expected Value
Chapter Closure
Section 5.1
5.1.1 Sine and Cosine Ratios
5.1.2 Selecting a Trig Tool
5.1.3 Inverse Trigonometry
5.1.4 Applications
Section 5.2
5.2.1 Special Right Triangles
5.2.2 Pythagorean Triples
Section 5.3
5.3.1 Finding Missing Parts of Triangles
5.3.2 Law of Sines
5.3.3 Law of Cosines
5.3.4 Ambiguous Triangles(Optional)
5.3.5 Choosing a Tool
Chapter Closure
Section 6.1
6.1.1 Congruent Triangles3
6.1.2 Conditions for Triangle Congruence
6.1.3 Congruence of Triangles Through Rigid Transformations3526.1.4Flowcharts for Congruence
6.1.5 Converses
Section 6.2
6.2.1 Angles on a Pool Table
6.2.2 Investigating a Triangle
6.2.3 Creating a Mathematical Model
6.2.4 Analyzing a Game’
6.2.5 Using Transformations and Symmetry to Design Snowflakes
Chapter Closure
Section 7.1
7.1.1 Properties of a Circle
7.1.2 Building a Tetrahedron
7.1.3 Shortest Distance Problems
7.1.4 Using Symmetry to Study Polygons
Section 7.2
7.2.1 Special Quadrilaterals and Proof
7.2.2 Properties of Rhombi
7.2.3 More Proofswith Congruent Triangles
7.2.4 MoreProperties of Quadrilaterals
7.2.5 Two-Column Proofs
7.2.6 Explore-Conjecture-Prove
Section 7.3
7.3.1 Studying Quadrilaterals on a Coordinate Grid
7.3.2 Coordinate Geometry and Midpoints
7.3.3 Identifying Quadrilaterals on a Coordinate Grid
Chapter Closure
Section 8.1
8.1.1 Pinwheels and Polygons
8.1.2 Interior Angles of Polygons
8.1.3 Angles of Regular Polygons
8.1.4 Regular Polygon Angle Connections
8.1.5 Finding Areas of Regular Polygons
Section 8.2
8.2.1 Area Ratios of Similar Figures
8.2.2 Ratios of Similarity
Section 8.3
8.3.1 A Special Ratio
8.3.2 Area and Circumference of a Circle
8.3.3 Circles in Context
Chapter Closure
Section 9.1
9.1.1 Three-Dimensional Solids
9.1.2 Volumesand Surface Areas of Prisms
9.1.3 Prisms and Cylinders
9.1.4 Volumes of Similar Solids
9.1.5 Ratios of Similarity
Section 9.2
9.2.1 Introduction to Constructions
9.2.2 Constructing Bisectors
9.2.3 More Explorations with Constructions
9.2.4 Other Constructions
Chapter Closure
Section 10.1
10.1.1 Introduction to Chords
10.1.2 Angles and Arcs
10.1.3 Chords and Angles
10.1.4 Tangents and Secants
10.1.5 Problem Solving with Circles
Section 10.2
10.2.1 Conditional Probability and Independence
10.2.2 Two-Way Tables
10.2.3 Applications of Probability
Section 10.3
10.3.1 The Fundamental Principle of Counting
10.3.2 Permutations
10.3.3 Combinations
10.3.4 Categorizing Counting Problems
10.3.5 Some Challenging Probability Problems
Chapter Closure
Section 11.1
11.1.1 Platonic Solids
11.1.2 Pyramids
11.1.3 Volume of a Pyramid
11.1.4 Surface Area and Volume of a Cone
11.1.5 Surface Area and Volume of a Sphere
Section 11.2
11.2.1 Coordinates on a Sphere
11.2.2 Tangents and Arcs
11.2.3 Secant and Tangent Relationships
Chapter Closure
Section 12.1
12.1.1 The Equation of a Circle
12.1.2 Completing the Square for Equations of Circles
12.1.3 Introduction to Conic Sections
12.1.4 Graphing a ParabolaUsing the Focus and Directrix
Section 12.2
12.2.1 Using Coordinate Geometry and Constructions to Explore Shapes
12.2.2 Euler’s Formula for Polyhedra
12.2.3 The Golden Ratio
12.2.4 Using Geometry to find Probabilities
Chapter Closure
Section 1.1
1.1.1 Solving Puzzles in Teams
1.1.2 Using a Graphing Calculator to Explore a Function
1.1.3 Domain and Range
1.1.4 Points of Intersection in Multiple Representations
Section 1.2
1.2.1 Modeling a Geometric Relationship
1.2.2 Function Investigation
1.2.3 The Family of Linear Functions
1.2.4 Function Investigation Challenge
Chapter Closure
Section 2.1
2.1.1 Modeling Non-Linear Data
2.1.2 Parabola Investigation
2.1.3 Graphing a Parabola Without a Table
2.1.4 Rewriting in Graphing Form
2.1.5 Mathematical Modeling with Parabolas
Section 2.2
2.2.1 Transforming Other Parent Graphs
2.2.2 Describing (h,k) for Each Family of Functions
2.2.3 Transformations of Functions
2.2.4 Transforming Non-Functions
2.2.5 Transforming Piecewise-Defined Functions
Chapter Closur
Section 3.1
3.1.1 Equivalent Expressions
3.1.2 Rewriting Expressions and Determining Equivalence
3.1.3 Solving by Rewriting
Section 3.2
3.2.1 Investigating Rational Functions
3.2.2 Simplifying Rational Expressions
3.2.3 Multiplying and Dividing Rational Expressions
3.2.4 Adding and Subtracting Rational Expressions
3.2.5 Creating New Functions
Chapter Closure
Section 4.1
4.1.1 Strategies for Solving Equations
4.1.2 Solving Equations and Systems Graphically
4.1.3 Finding Multiple Solutions to Systems of Equations
4.1.4 Using Systems of Equations to Solve Problems
Section 4.2
4.2.1 Solving Inequalities with One or Two Variables
4.2.2 Using Systems to Solve a Problem
4.2.3 Application of Systems of Linear Inequalities
4.2.4 Using Graphs to Find Solutions
Chapter Closure
Section 5.1
5.1.1 “Undo” Equations
5.1.2 Using a Graph to Find an Inverse
5.1.3 Finding Inverses and Justifying Algebraically
Section 5.2
5.2.1 Finding the Inverse of an Exponential Function
5.2.2 Defining the Inverse of an Exponential Function
5.2.3 Investigating the Family of Logarithmic Functions
5.2.4 Transformations of Logarithmic Functions
5.2.5 Investigating Compositions of Functions
Chapter Closure
Section 6.1
6.1.1 Creating a Three-Dimensional Model
6.1.2 Graphing Equations in Three Dimensions
6.1.3 Systems of Three-Variable Equations2666.1.4Solving Systems of Three Equations with Three Unknowns
6.1.5 Using Systems of Three Equations for Curve Fitting
Section 6.2
6.2.1 Using Logarithms to Solve Exponential Equations
6.2.2 Investigating the Properties of Logarithms
6.2.3 Writing Equations of Exponential Functions
6.2.4 An Application of Logarithms
Chapter Closure
Section 7.1
7.1.1 Introduction to Cyclic Models
7.1.2 Graphing the Sine Function
7.1.3 Unit Circle ↔Graph
7.1.4 Graphing and Interpreting the Cosine Function
7.1.5 Defining a Radian
7.1.6 Building a Unit Circle
7.1.7 The Tangent Function
Section 7.2 7.2.1 Transformations of y= sin x
7.2.2 One More Parameter for a Cyclic Function
7.2.3 Period of a Cyclic Function
7.2.4 Graph ↔Equation
Chapter Closure
Section 8.1
8.1.1 Sketching Graphs of Polynomial Functions
8.1.2 More Graphs of Polynomials
8.1.3 Stretch Factorsfor Polynomial Functions
Section 8.2
8.2.1 Introducing Imaginary Numbers
8.2.2 Complex Roots
8.2.3 More Complex Numbers and Equations
Section 8.3
8.3.1 Polynomial Division
8.3.2 Factors and Integral Roots
8.3.3 An Application of Polynomials
Chapter Closure
Section 9.1
9.1.1 Survey Design4
9.1.2 Samples and the Role of Randomness
9.1.3 Bias in Convenience Samples
Section 9.2
9.2.1 Testing Causeand Effect with Experiments
9.2.2 Conclusions From Studies
Section 9.3
9.3.1 Relative Frequency Histograms
9.3.2 The Normal Probability Density Function
9.3.3 Percentiles
Chapter Closure
Section 10.1
10.1.1 Introduction to Arithmetic Series
10.1.2 More Arithmetic Series
10.1.3 General Arithmetic Series
10.1.4 Summation Notation and Combinations of Series
Section 10.2
10.2.1 Geometric Series
10.2.2 Infinite Series
Section 10.3
10.3.1 Pascal’s Triangle and the Binomial Theorem
10.3.2 TheNumber e
Chapter Closure
Section 11.1
11.1.1 Simulations of Probability
11.1.2 More Simulations of Probability
11.1.3 Simulating Sampling Variability
Section 11.2
11.2.1 Statistical Test Using Sampling Variability
11.2.2 Variability in Experimental Results
11.2.3 Quality Control
11.2.4 Statistical Process Control
Section11.3
11.3.1 Analyzing Decisions and Strategies
Chapter Closure
Section 12.1
12.1.1 Analyzing Trigonometric Equations
12.1.2 Solutions to Trigonometric Equations
12.1.3 Inverses of Trigonometric Functions
12.1.4 Reciprocal Trigonometric Functions
Section 12.2
12.2.1 Trigonometric Identities
12.2.2 Proving Trigonometric Identities
12.2.3 Angle Sum and Difference Identities
Chapter Closure
Section A.1
A.1.1 Representing Exponential Growth
A.1.2 Rebound Ratios
A.1.3 The Bouncing Ball and Exponential Decay
Section A.2
A.2.1 Generating and Investigating Sequences
A.2.2 Generalizing Arithmetic Sequences
A.2.3 Recursive Sequences
Section A.3
A.3.1 Patterns of Growth in Tables and Graphs
A.3.2 Using Multipliers to Solve Problems
A.3.3 Comparing Sequences to Functions
Appendix Closure
Section B.1
B.1.1 Investigation y = bx
B.1.2 Multiple Representations of Exponential Functions
B.1.3 More Applications of Exponential Growth
B.1.4 Exponential Decay
B.1.5 Graph → Equation
B.1.6 Completing the Multiple Representations Web
Section B.2
B.2.1 Curve Fitting and Fractional Exponents
B.2.2 More Curve Fitting
B.2.3 Solving a System of Exponential Functions Graphically
Appendix Closure
Section C.1
C.1.1 Investigating Data Representations
C.1.2 Comparing Data
C.1.3 Standard Deviation
Appendix Closure
CP 1: Using Place Value to Round and Compare Decimals
CP 2: Addition and Subtraction of Decimals
CP 3: Addition and Subtraction of Fractions
CP 4: Addition and Subtraction of Mixed Numbers
CP 5: Multiple Representations of Portions
P 6: Locating Points on a Number Line and on a Coordinate Graph
CP 7A: Multiplication of Fractions and Decimals
CP 7B: Area and Perimeter of Quadrilaterals and Triangles
CP 8A: Rewriting and Evaluating Variable Expressions
CP 8B: Division of Fractions and Decimals
CP 9A: Displays of Data: Histograms and Box Plots
CP 9B: Solving One-Step Equations
Section 6.1
6.1.1 Comparing Expressions
6.1.2 Comparing Quantities with Variables
6.1.3 One Variable Inequalities
6.1.4 Solving One Variable Inequalities
Section 6.2
6.2.1 Solving Equations
6.2.2 Checking Solutions and the Distributive Property
6.2.3 Solving Equations and Recording Work
6.2.4 Using a Table to Write Equations from Word Problems
6.2.5 Writing and Solving Equations
6.2.6 Cases with Infinite or No Solutions
6.2.7 Choosing a Solving Strategy
Chapter Closure
Section 7.1
7.1.1 Distance, Rate, and Time
7.1.2 Scaling Quantities
7.1.3 Solving Problems Involving Percents
7.1.4 Equations with Fraction and Decimal Coefficients
7.1.5 Creating Integer Coefficients
7.1.6 Creating Integer Coefficients Efficiently
7.1.7 Percent Increase and Decrease
7.1.8 Simple Interest
Section 7.2
7.2.1 Finding Missing Information in Proportional Relationships
7.2.2 Solving Proportions
Chapter Closure
Section 8.1
8.1.1 Measurement Precision
8.1.2 Comparing Distributions
Section 8.2
8.2.1 Representative Samples
8.2.2 Inference from Random Samples
Section 8.3
8.3.1 Introduction to Angles
8.3.2 Classifying Angles
8.3.3 Constructing Shapes
8.3.4 Building Triangles
Chapter Closure
Section 9.1
9.1.1 Circumference, Diameter, and Pi
9.1.2 Area of Circles
9.1.3 Area of Composite Shapes
Section 9.2
9.2.1 Surface Area and Volume
9.2.2 Cross Sections
9.2.3 Volume of a Prism
9.2.4 Volume of Non-Rectangular Prisms
Chapter Closure
Section 9.3
9.3.1 Volume and Scaling
9.3.2 Using Multiple Math Ideas to Create an Interior Design
9.3.3 Applying Ratios
Checkpoint 1: Area and Perimeter of Polygons
Checkpoint 2: Multiple Representations of Portions
Checkpoint 3: Multiplying Fractions and Decimals
Checkpoint 5: Order of Operations
Checkpoint 6: Writing and Evaluating Algebraic Expressions
Checkpoint 7A: Simplifying Expressions
Checkpoint 7B: Displays of Data: Histograms and Box Plots
Checkpoint 8: Solving Multi-Step Equations
Checkpoint 9: Unit Rates and Proportions
Section 6.1
6.1.1 Rigid Transformations
6.1.2 Rigid Transformations on a Coordinate Graph
6.1.3 Describing Transformations
6.1.4 Using Rigid Transformations
Section 6.2
6.2.1 Multiplication and Dilation
6.2.2 Dilations and Similar Figures
6.2.3 Identifying Similar Shapes
6.2.4 Similar Figures and Transformations
6.2.5 Working With Corresponding Sides
6.2.6 Solving Problems Involving Similar Shapes
Chapter Closure
Section 7.1
7.1.1 Circle Graphs
7.1.2 Organizing Data in a Scatterplot
7.1.3 Identifying and Describing Association
Section 7.2
7.2.1 y = mx + b Revisited
7.2.2 Slope
7.2.3 Slope in Different Representations
7.2.4 More About Slope
7.2.5 Proportional Equations
Section 7.3
7.3.1 Using Equations to Make Predictions
7.3.2 Describing Association Fully
7.3.3 Association Between Categorical Variables
Chapter Closure
Section 8.1
8.1.1 Patterns of Growth in Tables and Graphs
8.1.2 Compound Interest
8.1.3 Linear and Exponential Growth
Section 8.2
8.2.1 Exponents and Scientific Notation
8.2.2 Exponent Rules
8.2.3 Negative Exponents
8.2.4 Operations with Scientific Notation
Section 8.3
8.3.1 Functions in Graphs and Tables
Chapter Closure
Section 9.1
9.1.1 Parallel Line Angle Pair Relationships
9.1.2 Finding Unknown Angles in Triangles
9.1.3 Exterior Angles in Triangles
9.1.4 AA Triangle Similarity
Section 9.2
9.2.1 Side Lengths and Triangles
9.2.2 Pythagorean Theorem
9.2.3 Understanding Square Root
9.2.4 Real Numbers
9.2.5 Applications of the Pythagorean Theorem
9.2.6 Pythagorean Theorem in Three Dimensions
9.2.7 Pythagorean Theorem Proofs
Chapter Closure
Section 10.1
10.1.1 Cube Roots
10.1.2 Surface Area and Volume of a Cylinder
10.1.3 Volumes of Cones and Pyramids
10.1.4 Volume of a Sphere
10.1.5 Applications of Volume
Chapter Closure
10.2.1 Indirect Measurement
10.2.2 Finding Unknowns
10.2.3 Analyzing Data to Identify a Trend
1. Operations with Signed Fractions and Decimals
2. Evaluating Expressions and Using Order of Operations
3. Unit Rates and Proportions
4. Area and Perimeter of Circles and Composite Figures
5. Solving Equations
6. Multiple Representations of Linear Equations
7. Solving Equations with Fractions and Decimals (Fraction Busters)
8. Transformations
9. Scatterplots and Association
0.1.1
Who are my classmates?
0.1.2
How do I work collaboratively?
0.1.3
What questions can I ask?
0.1.4
How can I categorize my words?
0.1.5
How can I communicate my ideas?
0.1.6
How can the team build this together?
0.1.7
What do we need to work togethe
1.1 Numbers and Data
1.1.1 How should data be placed on this line?
1.1.2 Where do these numbers belong on this line?
1.1.3 How can I use two lines to solve problems?
1.1.4 How can data be used to answer a question?
1.1.5 How are histograms helpful?
1.1.6 How else can data be displayed?
1.2 Shapes and Area,
1.2.1 How can I write equivalent expressions in area and perimeter?
1.2.2 What shapes make up the polygon?
1.2.3 How can I make it a rectangle?
1.3 Expressions
1.3.1 How can I describe it using symbols?
1.3.2 What are the parts of an expression?
1.3.3 How do I work with decimals?
1.3.4 How do I multiply multi-digit decimals?
1.3.5 How can I represent the arrangement?
2.1 Ratio Language
2.1.1 How can I compare two quantities?
2.1.2 How can I write ratios?
2.1.3 How can I see ratios in data representations?
2.2 Equivalent Ratios
2.2.1 How can I visualize ratios?
2.2.2 How can I see equivalent ratios in a table?
2.2.3 How can I see equivalent ratios in a double number line?
2.2.4 How can I see equivalent ratios in tape diagrams?
2.2.5 How can I use equivalent ratios?
2.2.6 What do these represent?
2.3 Measurement
2.3.1 What are the measurements?
2.3.2 What are the units?
2.3.3 How can I convert units
3.1 Measures of Center
3.1.1 How can I measure the center?
3.1.2 How else can I measure the center?
3.1.3 Which is the better measure of center?
3.1.4 What happens when I change the data?
3.2 Integers
3.2.1 What numbers do I see?
3.2.2 What number is this?
3.2.3 What does a number line say about a number?
3.2.4 How do I compare different types of numbers?
3.3 Absolute Value
3.3.1 How do I describe the location?
3.3.2 How far do I walk?
3.3.3 Which one is greater?
3.3.4 How do I communicate mathematically?
3.4 Coordinate Plane
3.4.1 How can you precisely indicate a location?
3.4.2 What is the correct order?
3.4.3bWhat symbol represents me?
4.1 Fractions, Decimals, and Percents
4.1.1 How can I tell if the ratios are equal?
4.1.2 What does “percent” mean?
4.1.3 How can I convert a fraction?
4.1.4 How can I convert a percent?
4.1.5 How can I convert a decimal?
5.1 Variation in Data
5.1.1 How do I ask a statistical question?
5.1.2 What does each representation say about the data?
5.1.3 What does the box in a box plot represent?
5.1.4 How else can I describe data?
5.2 Area
5.2.1 What is the height?
5.2.2 Can I reconfigure a parallelogram into a rectangle?
5.2.3 How do I calculate the area?
5.2.4 How many triangles do I need?
5.2.5 What is my perspective?
5.2.6 Is it fair to play by the rules?
5.2.7 What shapes do I see?
5.3 Fractions
5.3.1 How can I represent fraction multiplication?
5.3.2 How can I multiply fractions?
5.3.3 How can I multiply mixed numbers?
6.1 Rules of Operations
6.1.1 What does it mean?
6.1.2 What do mathematicians call this?
6.1.3 How much should I ask for?
6.1.4 How can I write mathematical expressions?
6.1.5 How do mathematicians abbreviate?
6.1.6 In what order should I evaluate?
6.2 Multiples and Factors
6.2.1 When will they be the same?
6.2.2 What are multiples?
6.2.3 What do they have in common?
6.2.4 Who is your secret valentine?
6.2.5 How can I understand products?
6.2.6 How can I rewrite expressions?
6.2.7 Which method do I use?
7.1 Whole Number and Decimal Division
7.1.1 How can I share equally?
7.1.2 Which strategy is the most efficient?
7.1.3 How can I write the number sentence?
7.1.4 How can I divide decimals?
7.1.5 How should the problem be arranged?
7.2 Fraction Division
7.2.1 What if the divisor is a fraction?
7.2.2 How many fit?
7.2.3 How can I visualize this?
7.2.4 What is common about this?
7.2.5 How can I use a Giant One?
7.2.6 Which method is most efficient?
8.1. Algebra Tiles
8.1.1 What do these shapes represent?
8.1.2 What does a group of tiles represent?
8.1.3 What is an equivalent expression?
8.1.4 Which terms can be combined?
8.1.5 What do the numbers mean?
8.1.6 What can a variable represent?
8.2 Expressions
8.2.1 How can I count it?
8.2.2 What if the size of the pool is unknown?
8.2.3 How can I use an algebraic expression?
8.3 Equations and Inequalities
8.3.1 Which values make the equation true?
8.3.2 How can patterns be represented?
8.3.3 What is the equation?
8.3.4 How many could there be?
0.1.1 What do they have in common?
0.1.2 How can I effectively communicate with my team?
0.1.3 Is there another perspective?
0.1.4 How can I persevere through struggle?
0.1.5 How can I see this happening?
0.1.6 What patterns can I recognize?
0.1.7 What is the best strategy?
0.1.8 How does respect look?
1.1 Data and Graphs
1.1.1 How can I represent data?
1.1.2 How can I use data to solve a problem?
1.1.3 Is the roller coaster safe?
1.1.4 Is there a relationship?
1.1.5 What is the relationship?
This professional learning is designed for teachers as they begin their implementation of CPM. This series contains multiple components and is grounded in multiple active experiences delivered over the first year. This learning experience will encourage teachers to adjust their instructional practices, expand their content knowledge, and challenge their beliefs about teaching and learning. Teachers and leaders will gain first-hand experience with CPM with emphasis on what they will be teaching. Throughout this series educators will experience the mathematics, consider instructional practices, and learn about the classroom environment necessary for a successful implementation of CPM curriculum resources.
Page 2 of the Professional Learning Progression (PDF) describes all of the components of this learning event and the additional support available. Teachers new to a course, but have previously attended Foundations for Implementation, can choose to engage in the course Content Modules in the Professional Learning Portal rather than attending the entire series of learning events again.